Revealing the Truth About the Takarkori Pastoralists via F-statistics & African Americans
Below is a bar-graph of f3(Chimp; USA_MD_Catoctin_AfricanAmerican.AG, X). The f3 values represent degrees of genetic drift that an African American population (USA_MD_Catoctin_AfricanAmerican.AG) shares with other modern human populations relative to chimpanzees (i.e. drift that's not shared with chimpanzees). Modern humans share ~98.5% of our DNA with chimpanzees, so using them as an outgroup assures that the f3 values correspond to genetic drift that's shared by only modern humans.
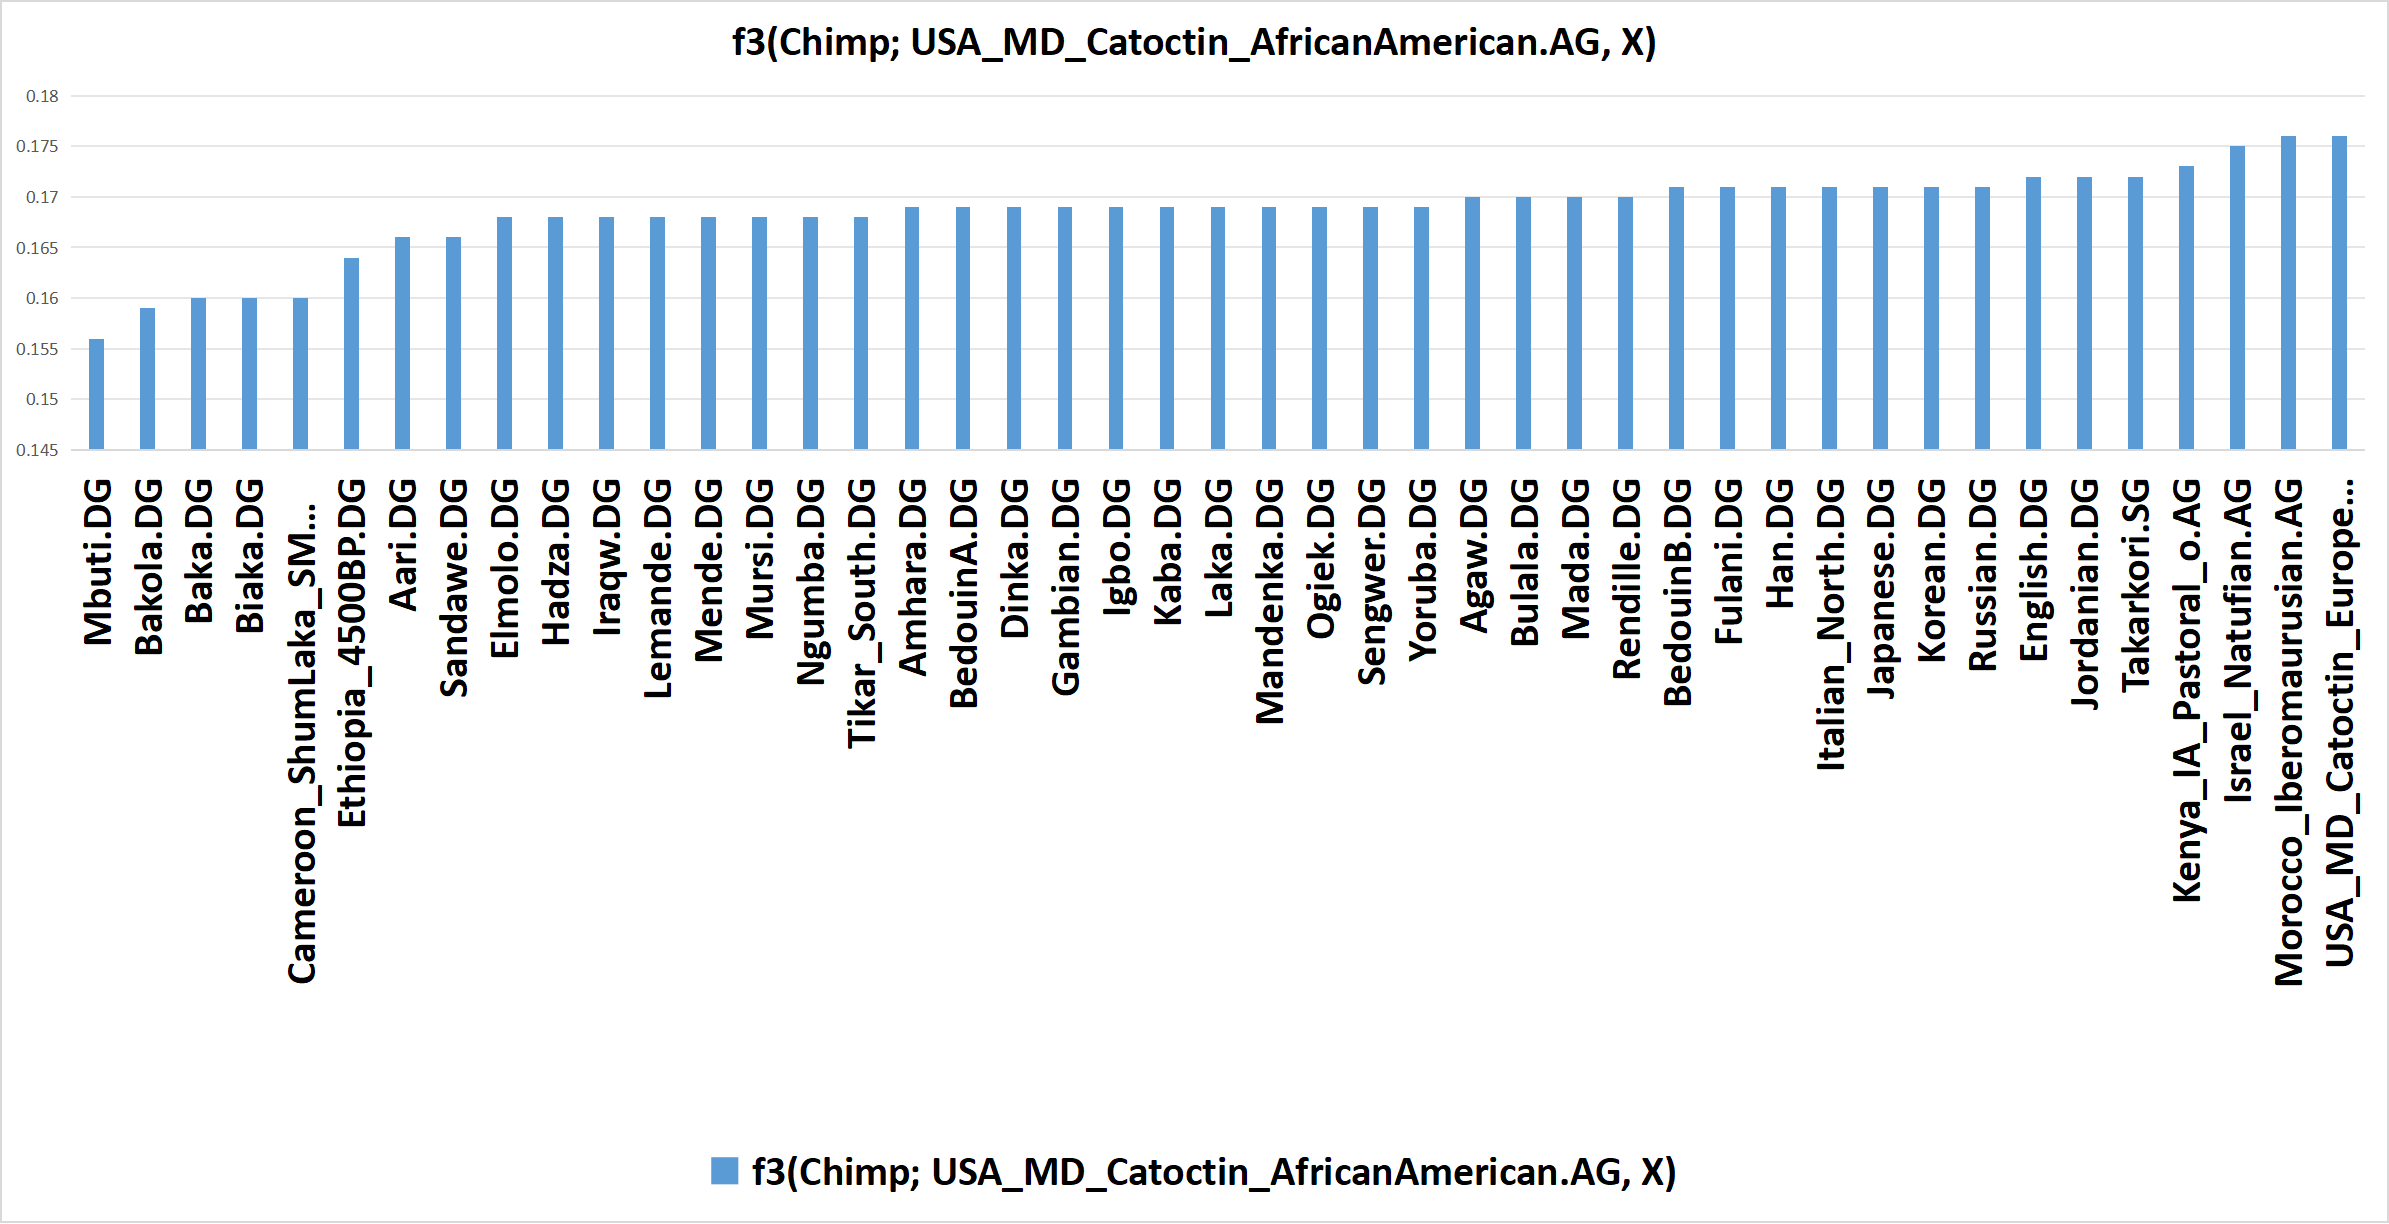
Bar graph of f3(Chimp; USA_MD_Catoctin_AfricanAmerican.AG, X), based on calculations computed by AdmixTools 2 using Version 62 of the AADR (and appended populations). Click here to see the input & output data in AdmixTools 2 that was used to produce this bar graph.
As can be seen, the f3 values are highest when X is a virtually pure Eurasian population - with only five exceptions:
X = USA_MD_Cactoctin_EuropeanMix.AG
X = Morocco_Iberomaurusian.AG
X = Israel_Natufian.AG
X = Kenya_IA_Pastoral_o.AG
X = Takarkori.SG
These five populations are exceptions because - like the African American population - they carry mixtures of Aboriginal African and Eurasian ancestries (though in very different proportions). Therefore, they share both Aboriginal African and Eurasian genetic drift with the African American population - rather than only one or the other.
USA_MD_Catoctin_AfricanAmerican.AG = Niger-Congo + West Eurasian (European) ancestries
USA_MD_Cactoctin_EuropeanMix.AG = Niger-Congo + West Eurasian (European) ancestries
Morocco_Iberomaurusian.AG = West Eurasian (Dzudzuana-related) + Ancestral North African ancestries
Israel_Natufian.AG = West Eurasian (Dzudzuana-related) + Ancestral North African ancestries
Kenya_IA_Pastoral_o.AG = Dinka-related East African + Mota-related East African + Natufian-related Eurasian ancestries
Takarkori.SG = Sudanic African (West + East African Mix) + Iberomaurusian ancestries
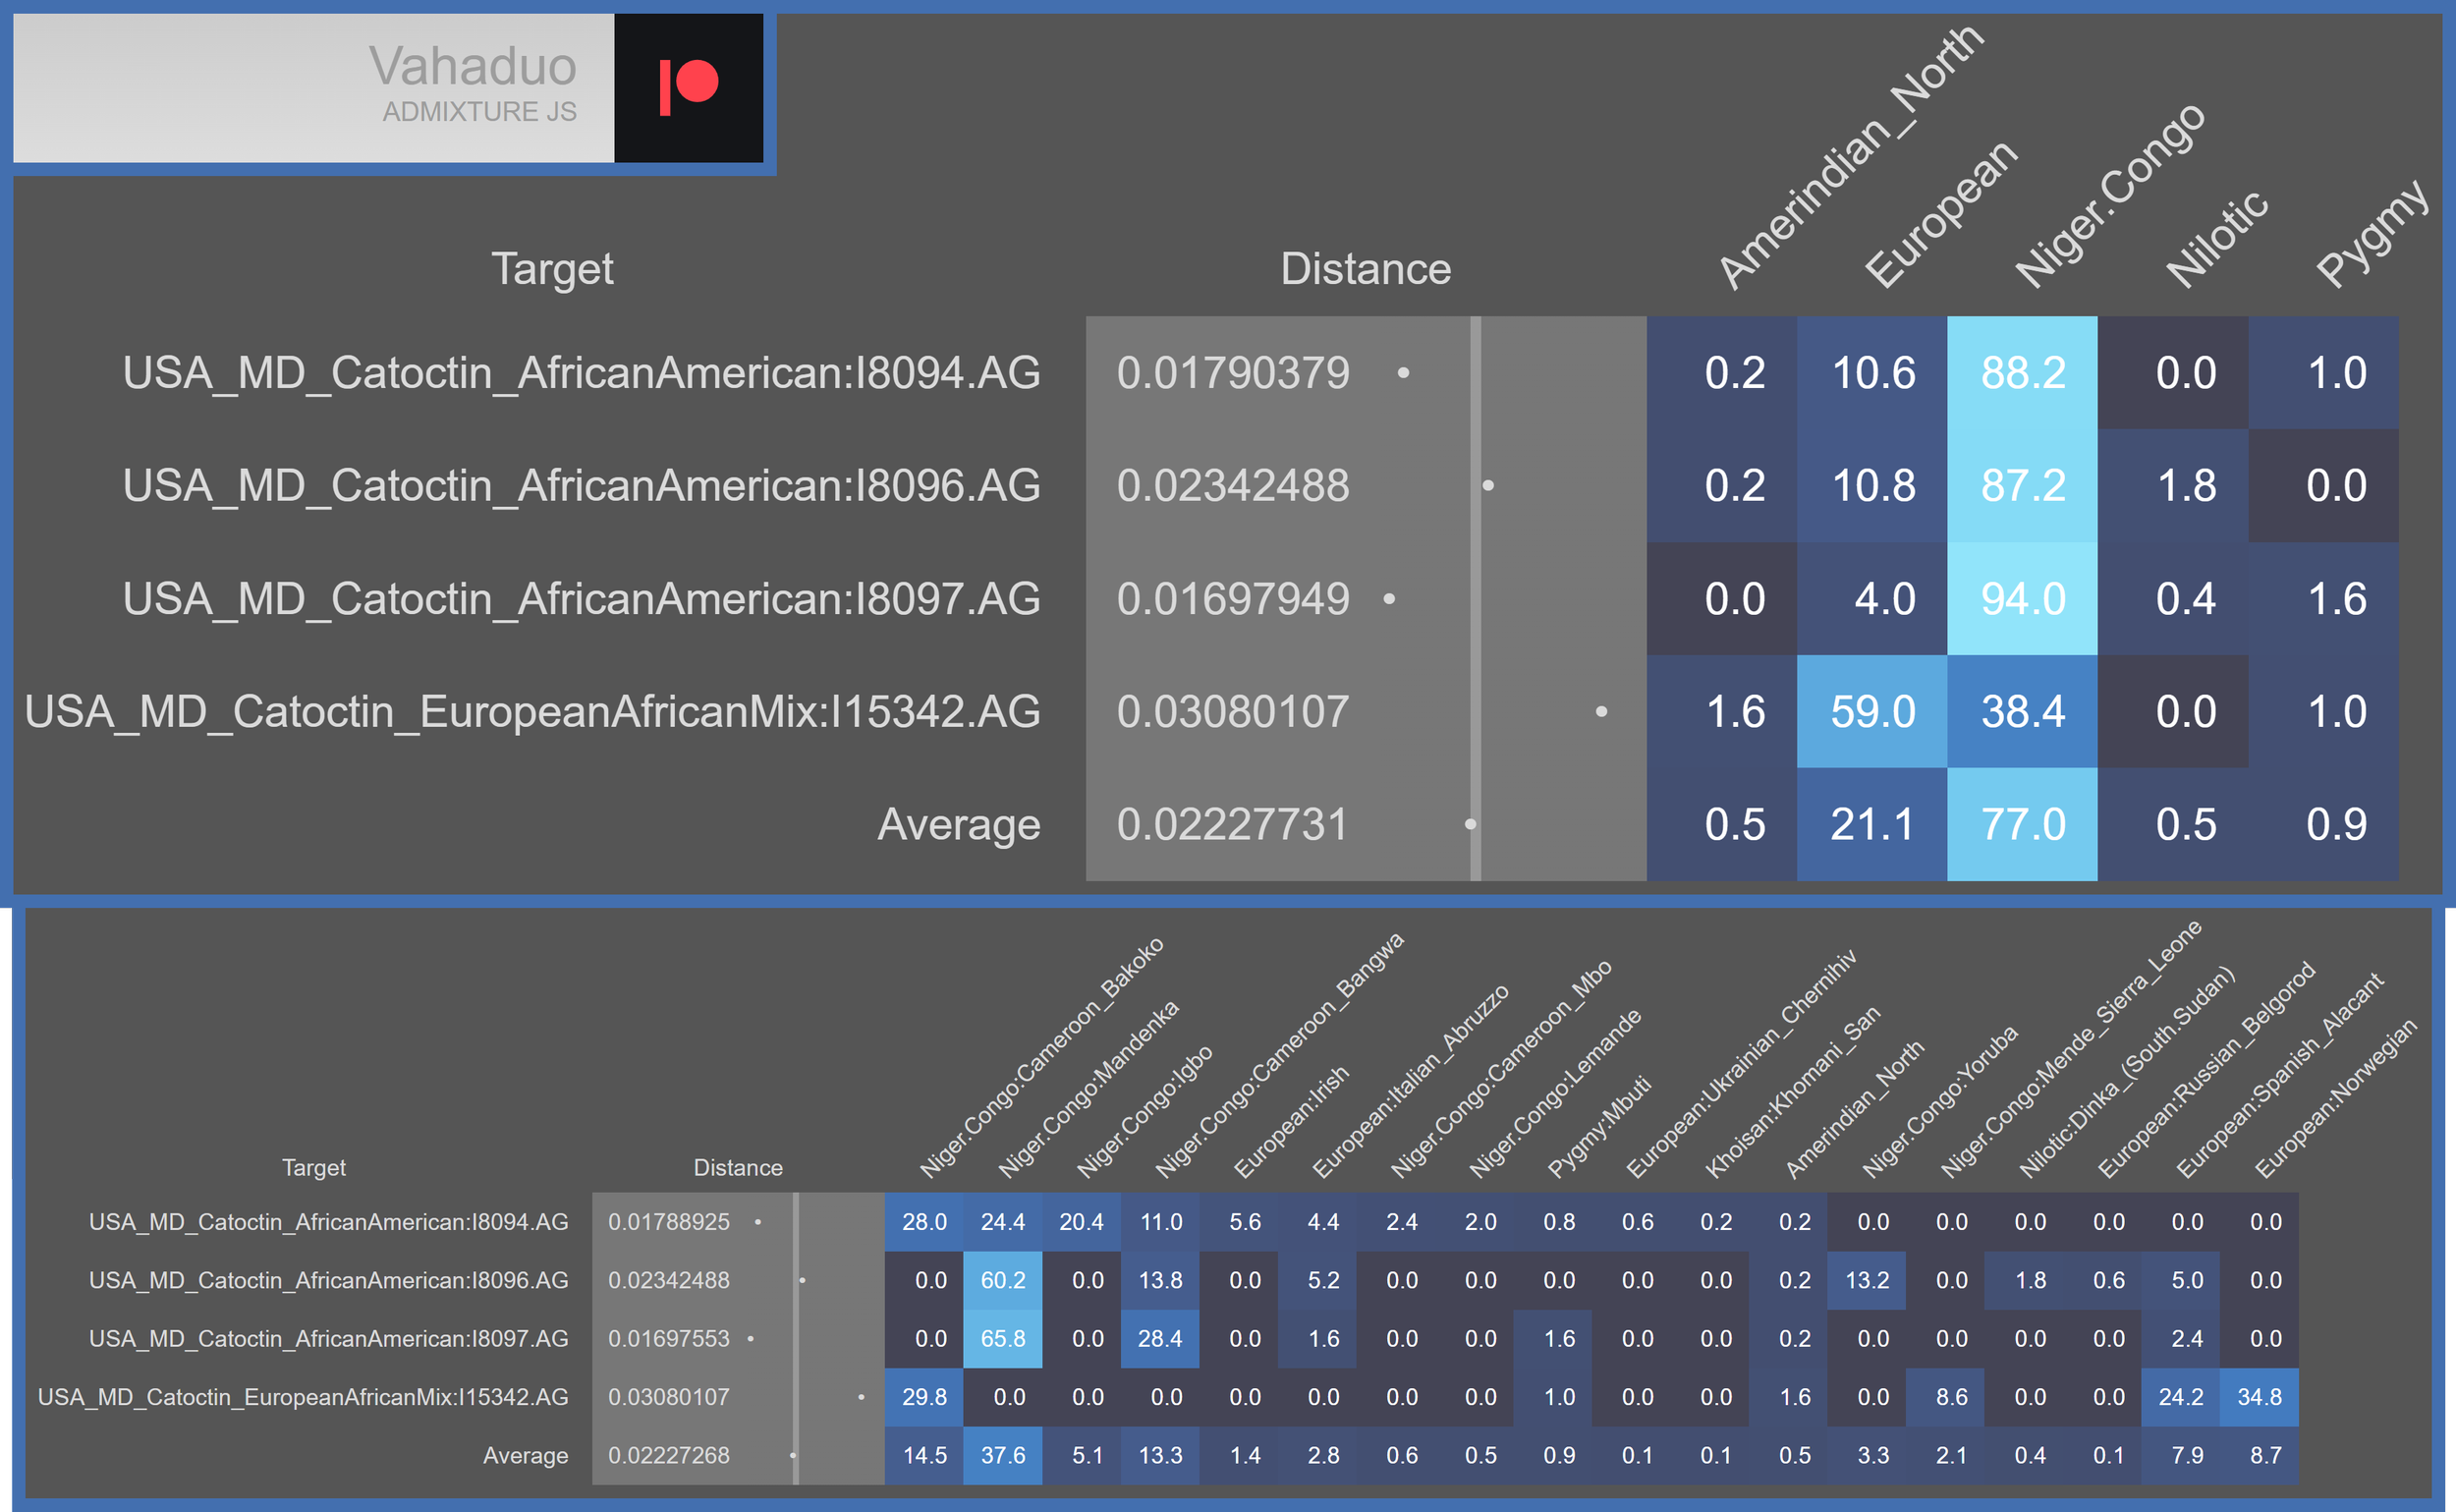
Ancestry models of African Americans who partly comprise USA_MD_Catoctin_AfricanAmerican.AG, and that of the individual who comprises USA_MD_Cactoctin_EuropeanMix.AG. Note that the African American individuals are modelled overwhelmingly as Niger-Congo. These models were generated via Vahaduo Admixture calculator.
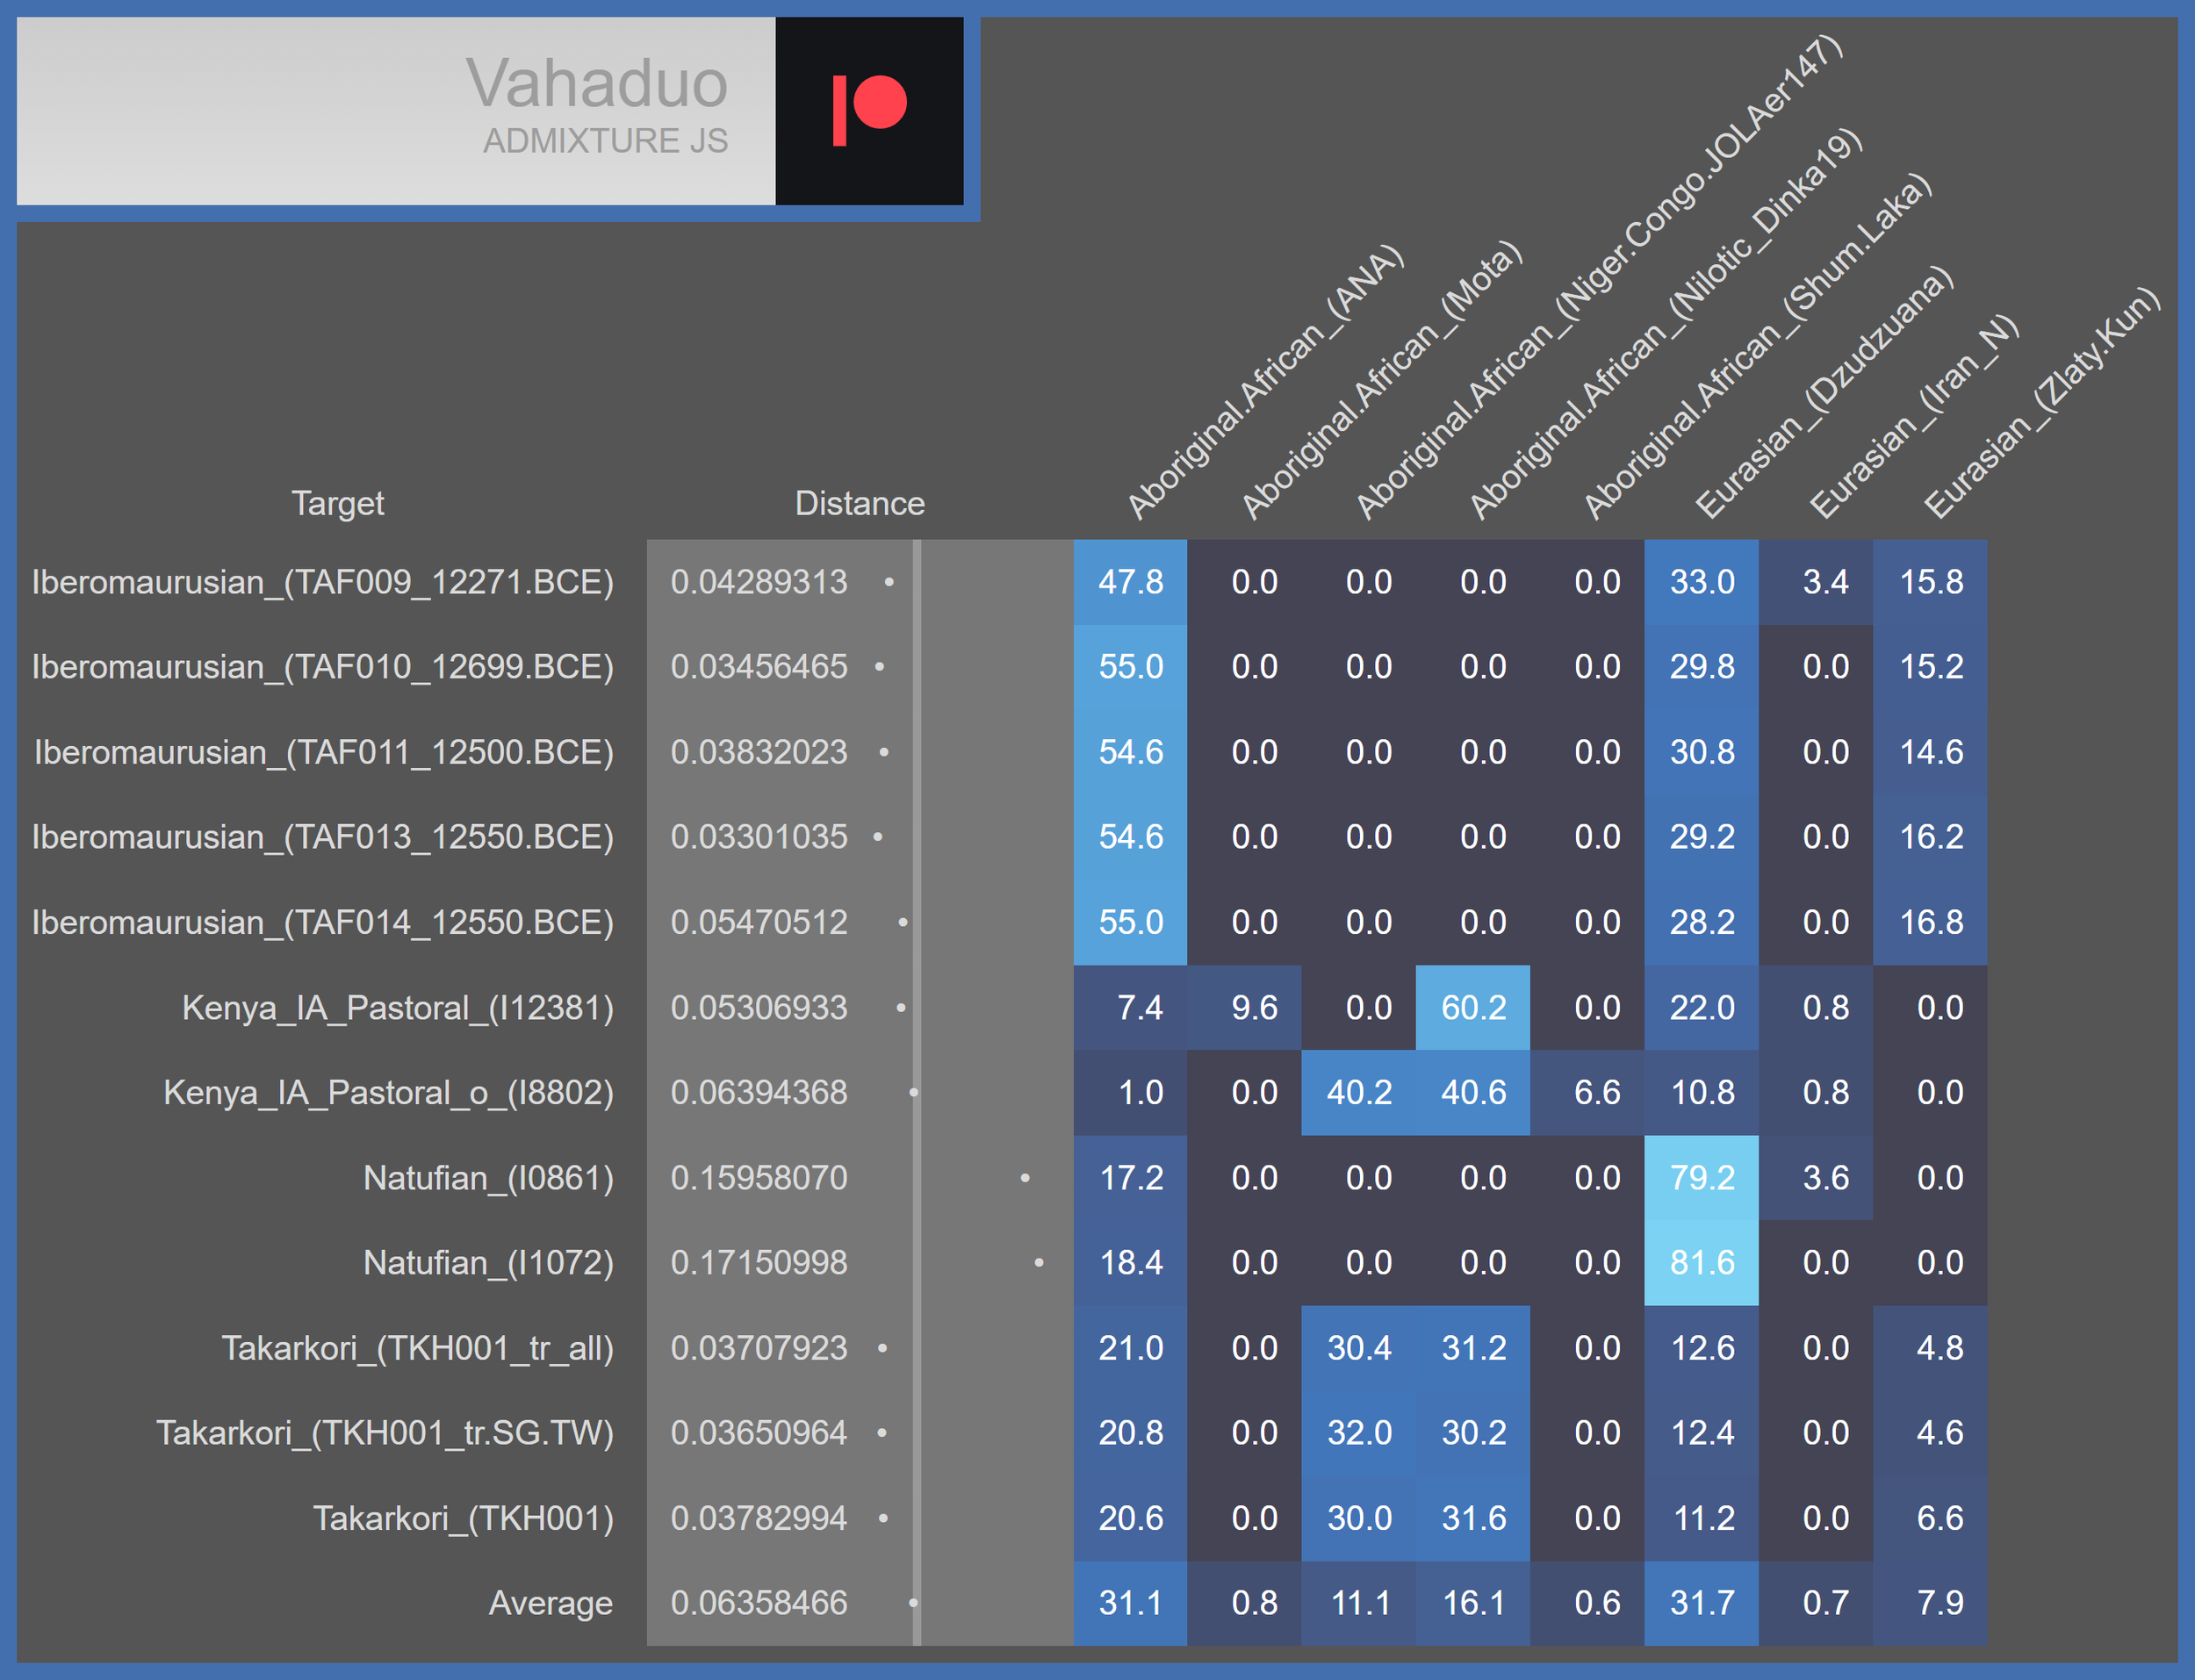
Ancestry models of the ancient populations with which USA_MD_Catoctin_AfricanAmerican.AG shares the most genetic drift in the previously shown bar graph. Note that they all carry mixtures of Aboriginal African and Eurasian ancestries, as does USA_MD_Catoctin_AfricanAmerican.AG.
What this data indicates is that f-statistics do not necessarily correspond to overall genetic relatedness or overall genetic similarity. If that were so, then the African American population would not share more genetic drift with the Eurasian populations than it does with most of the Aboriginal African populations, especially those that are Niger-Congo (i.e. Gambian, Igbo, Lemande, Mandenka, Mende, Tikar, Yoruba, etc); this is because African Americans are predominantly Niger-Congo and only minorly European, so they are obviously more related to Niger-Congo peoples than they are to any Eurasian population.
The reasons for this apparent discrepancy are the following:
Genetic drift is the change in frequencies of alleles (i.e. gene variants) within a lineage over time, which is the primary means by which modern human populations have become different from one another.
All modern humans are at least ~99.5% genetically identical, so the genomes of any two modern humans differ by only ~0.5% at most, regardless of whatever demographic groups to which they belong. Therefore, Eurasian lineages and the Aboriginal African lineages from which they split have become only ~0.5% different at most, ever since the former’s collective ancestors participated in a migration out of Africa ~65 kya (which is known as Out of Africa or OOA).
Note that Eurasian populations are genetically different from Aboriginal African populations to different degrees, as some Eurasian populations are more genetically similar to Aboriginal African populations than others, even when West Eurasian admixture in certain Aboriginal African populations is accounted for.
Aboriginal Africans carry ~20% more ancestral alleles than Eurasians. This is stated in the peer-reviewed scientific article, Ancestral Alleles and Population Origins: Inferences Depend on Mutation Rate (2007).
“… Watkins et al. (2003) studied a sample of 100 Alu loci. Within this sample, the mean ancestral allele frequency was about 20% higher in Africa than in non-African populations. Similar results were obtained by Mountain et al. (1992) (using classical loci) and by Mountain and Cavalli-Sforza (1994) (using restriction polymorphisms).”
This means that Eurasians have experienced more genetic drift since OOA than Aboriginal Africans have.
Because modern human populations differ from one another to such a small degree (~0.5% or less), the overwhelming majority of genetic drift that they all carry is the same; this means that only a very small amount of the genetic drift in any of them is unique. Therefore, if only a minor percentage of ancestry introgresses from Population A into Population B1, then Population B1 may subsequently share more unique genetic drift with Population A than it does with more closely related populations, such as Population B2 (e.g. 10% or less European admixture in African Americans causes them to share more unique genetic drift with Europeans than with Niger-Congo peoples - even though African Americans’ ancestry is overwhelmingly Niger-Congo).
This uniquely shared genetic drift combines with the rest of Population B1’s genetic drift (the overwhelming majority of which it also shares with Populations A - as well as B2 and all other modern human populations), thereby causing Population B1 to share the most genetic drift with Population A rather than Population B2.
This phenomenon is strongest in cases in which Population A is Eurasian and Population B1 is Aboriginal African, due to Aboriginal Africans carrying 20% more ancestral alleles than Eurasians and therefore being less drifted compared to Eurasians.
Consider the following bar graph of FST(USA_MD_Catoctin_AfricanAmerican.AG, X). An FST (fixation index) value corresponds to the total genetic difference between two populations across a selected set of genetic markers, such as SNPs (single nucleotide polymorphisms); therefore, the larger an FST value is, the more different two populations are; this is opposite of f-statistics, in which the larger an f-statistic is, the more genetic drift that two populations share.
As can be seen, the FST values transition from lowest to highest as X transitions in the following order: Niger-Congo Aboriginal African, Non-Niger-Congo Aboriginal African, Eurasian, and “Afro-Eurasian” (i.e. Aboriginal African with notable Eurasian admixture or Eurasian with notable Aboriginal African admixture). This clearly indicates that the African American population is most similar to Niger-Congo populations, as stated earlier herein.
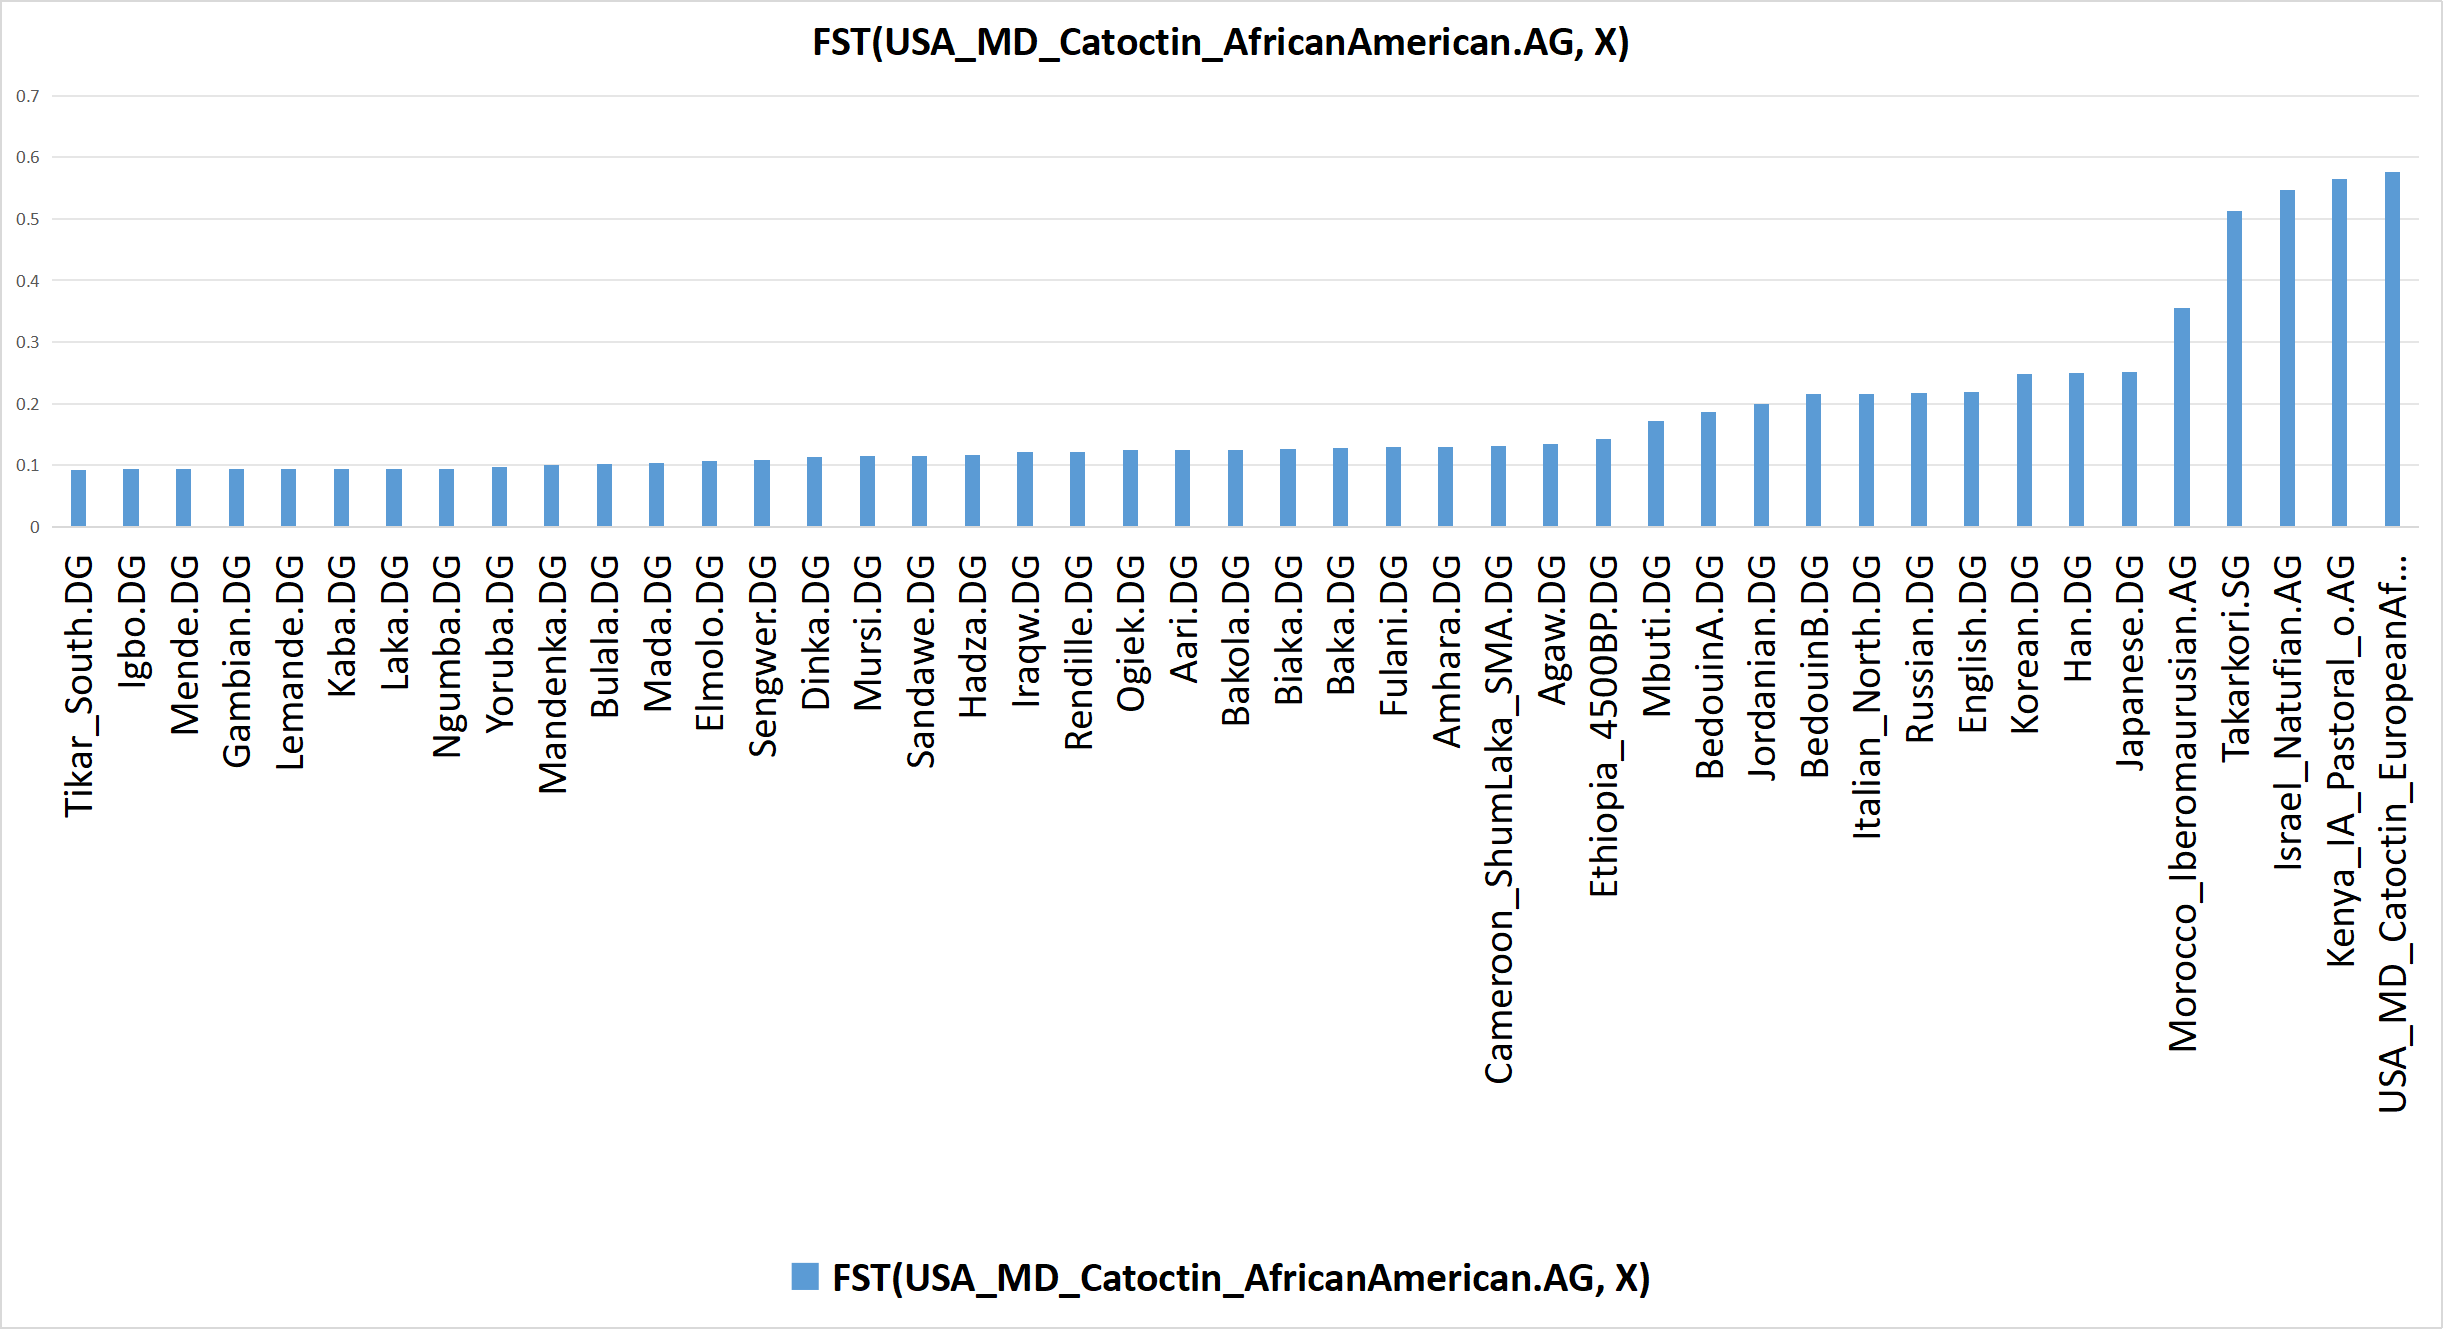
Bar graph of FST(USA_MD_Catoctin_AfricanAmerican.AG, X), based on calculations computed by AdmixTools 2 using Version 62 of the AADR [Allen Ancient DNA Resource] (and appended populations). Click here to see the input & output data in AdmixTools 2 that was used to produce this bar graph.
That f-statistics do not necessarily correspond to overall genetic relatedness or overall genetic similarity is relevant to Salem et al (2025): Ancient DNA from the Green Sahara reveals ancestral North African lineage. Salem et al (2025) uses f-statistics to present erroneous conclusions about a combined sample of two ancient pastoralists, whose fossilized remains were discovered in the Takarkori Rock Shelter of Libya (along with several other pastoralists); the two pastoralists whose genomes were combined into one sample have been designated TKH001 & TKH009, and they have been estimated to have lived ~7000 years ago. The article includes several charts of f3 and f4 statistics, which show that the pastoralists share the most genetic drift with Iberomaurusians; it subsequently asserts that they were not closely related to Sub-Saharan Africans (i.e. Aboriginal Africans that reside south of the Sahara).
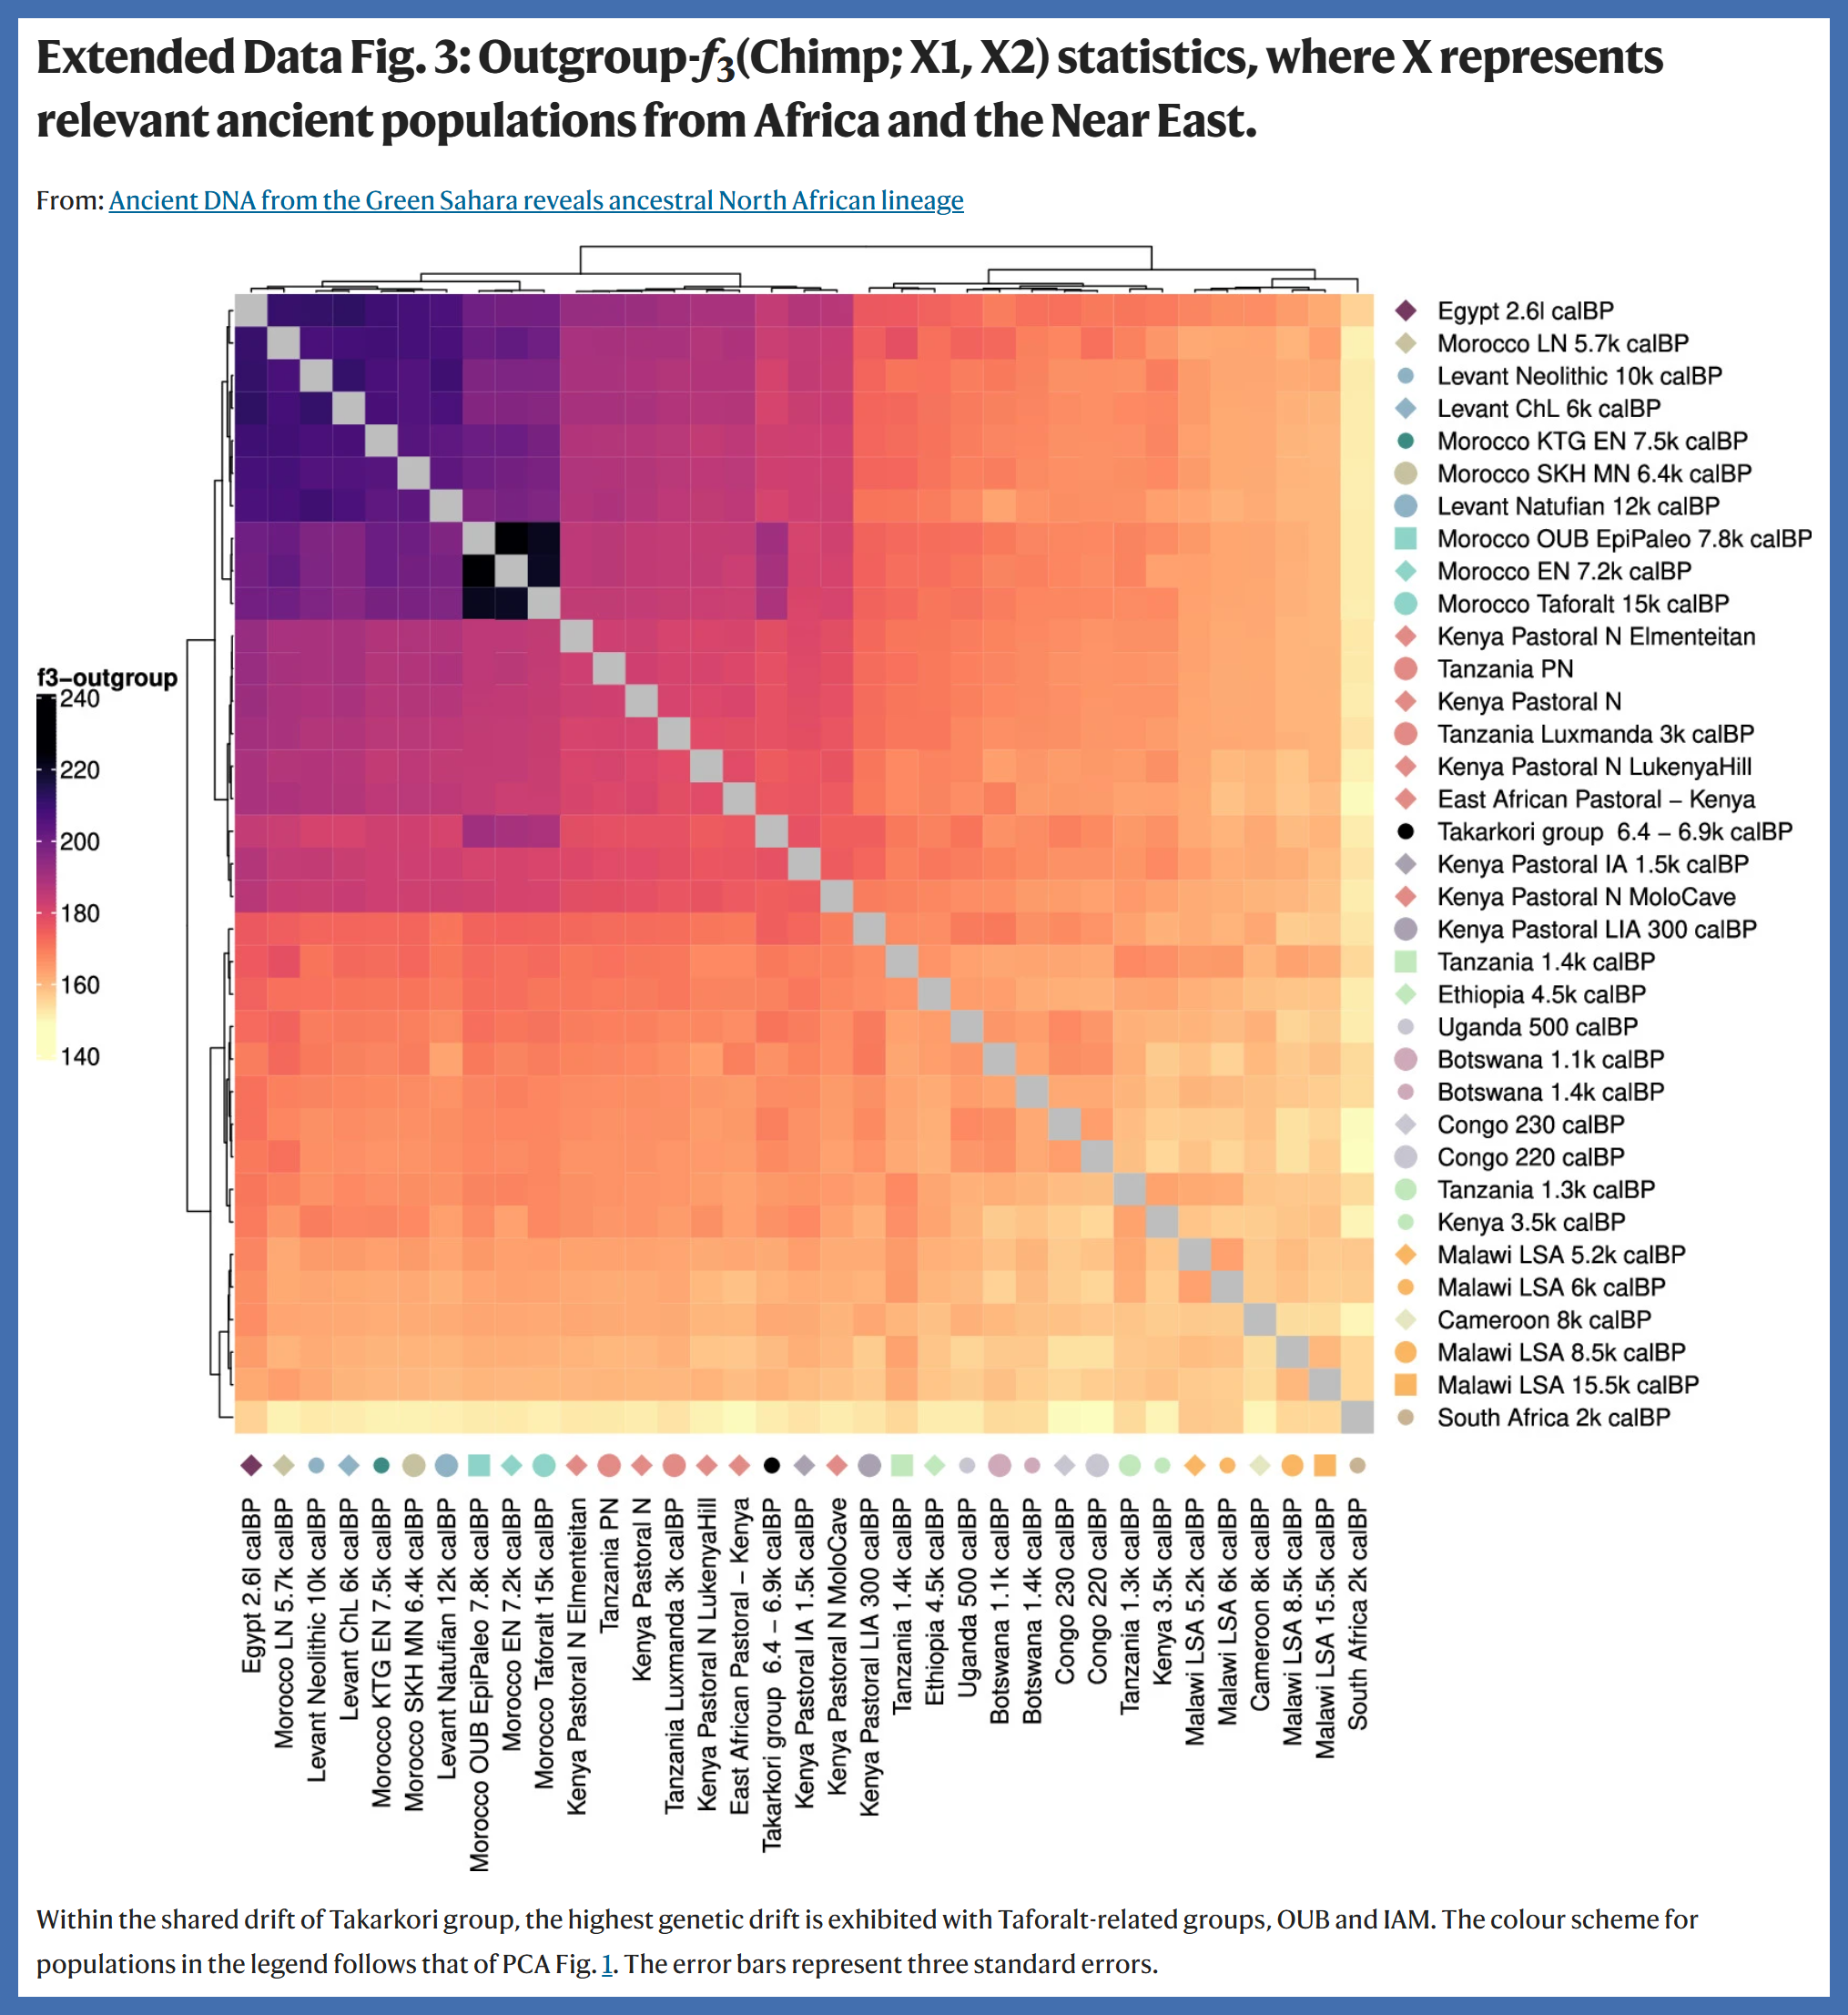
Extended Data Figure 3 of Salem et al (2025), which is a representation of f3(Chimp; X1, X2). The darker that a square is, the higher that the corresponding f3 value is. As can be seen, the squares that correspond to f3(Chimp; Takarkori group, [Morocco Taforalt | Morocco EN | Morocco OUB EpiPaleo]) are darker than any other value of f3(Chimp; Takarkori group, X2), which indicates that the Takarkori pastoralists share the most drift with Morocco Taforalt, Morocco EN, and Morocco OUB EpiPaleo - all three of which are Iberomaurusian.
However, recall that the overwhelming majority of genetic drift in all modern human populations is the same. Therefore, most of the genetic drift that the Takarkori pastoralists share with Iberomaurusians is also shared by Sub-Saharan Africans, as can be seen in the bar graph below.
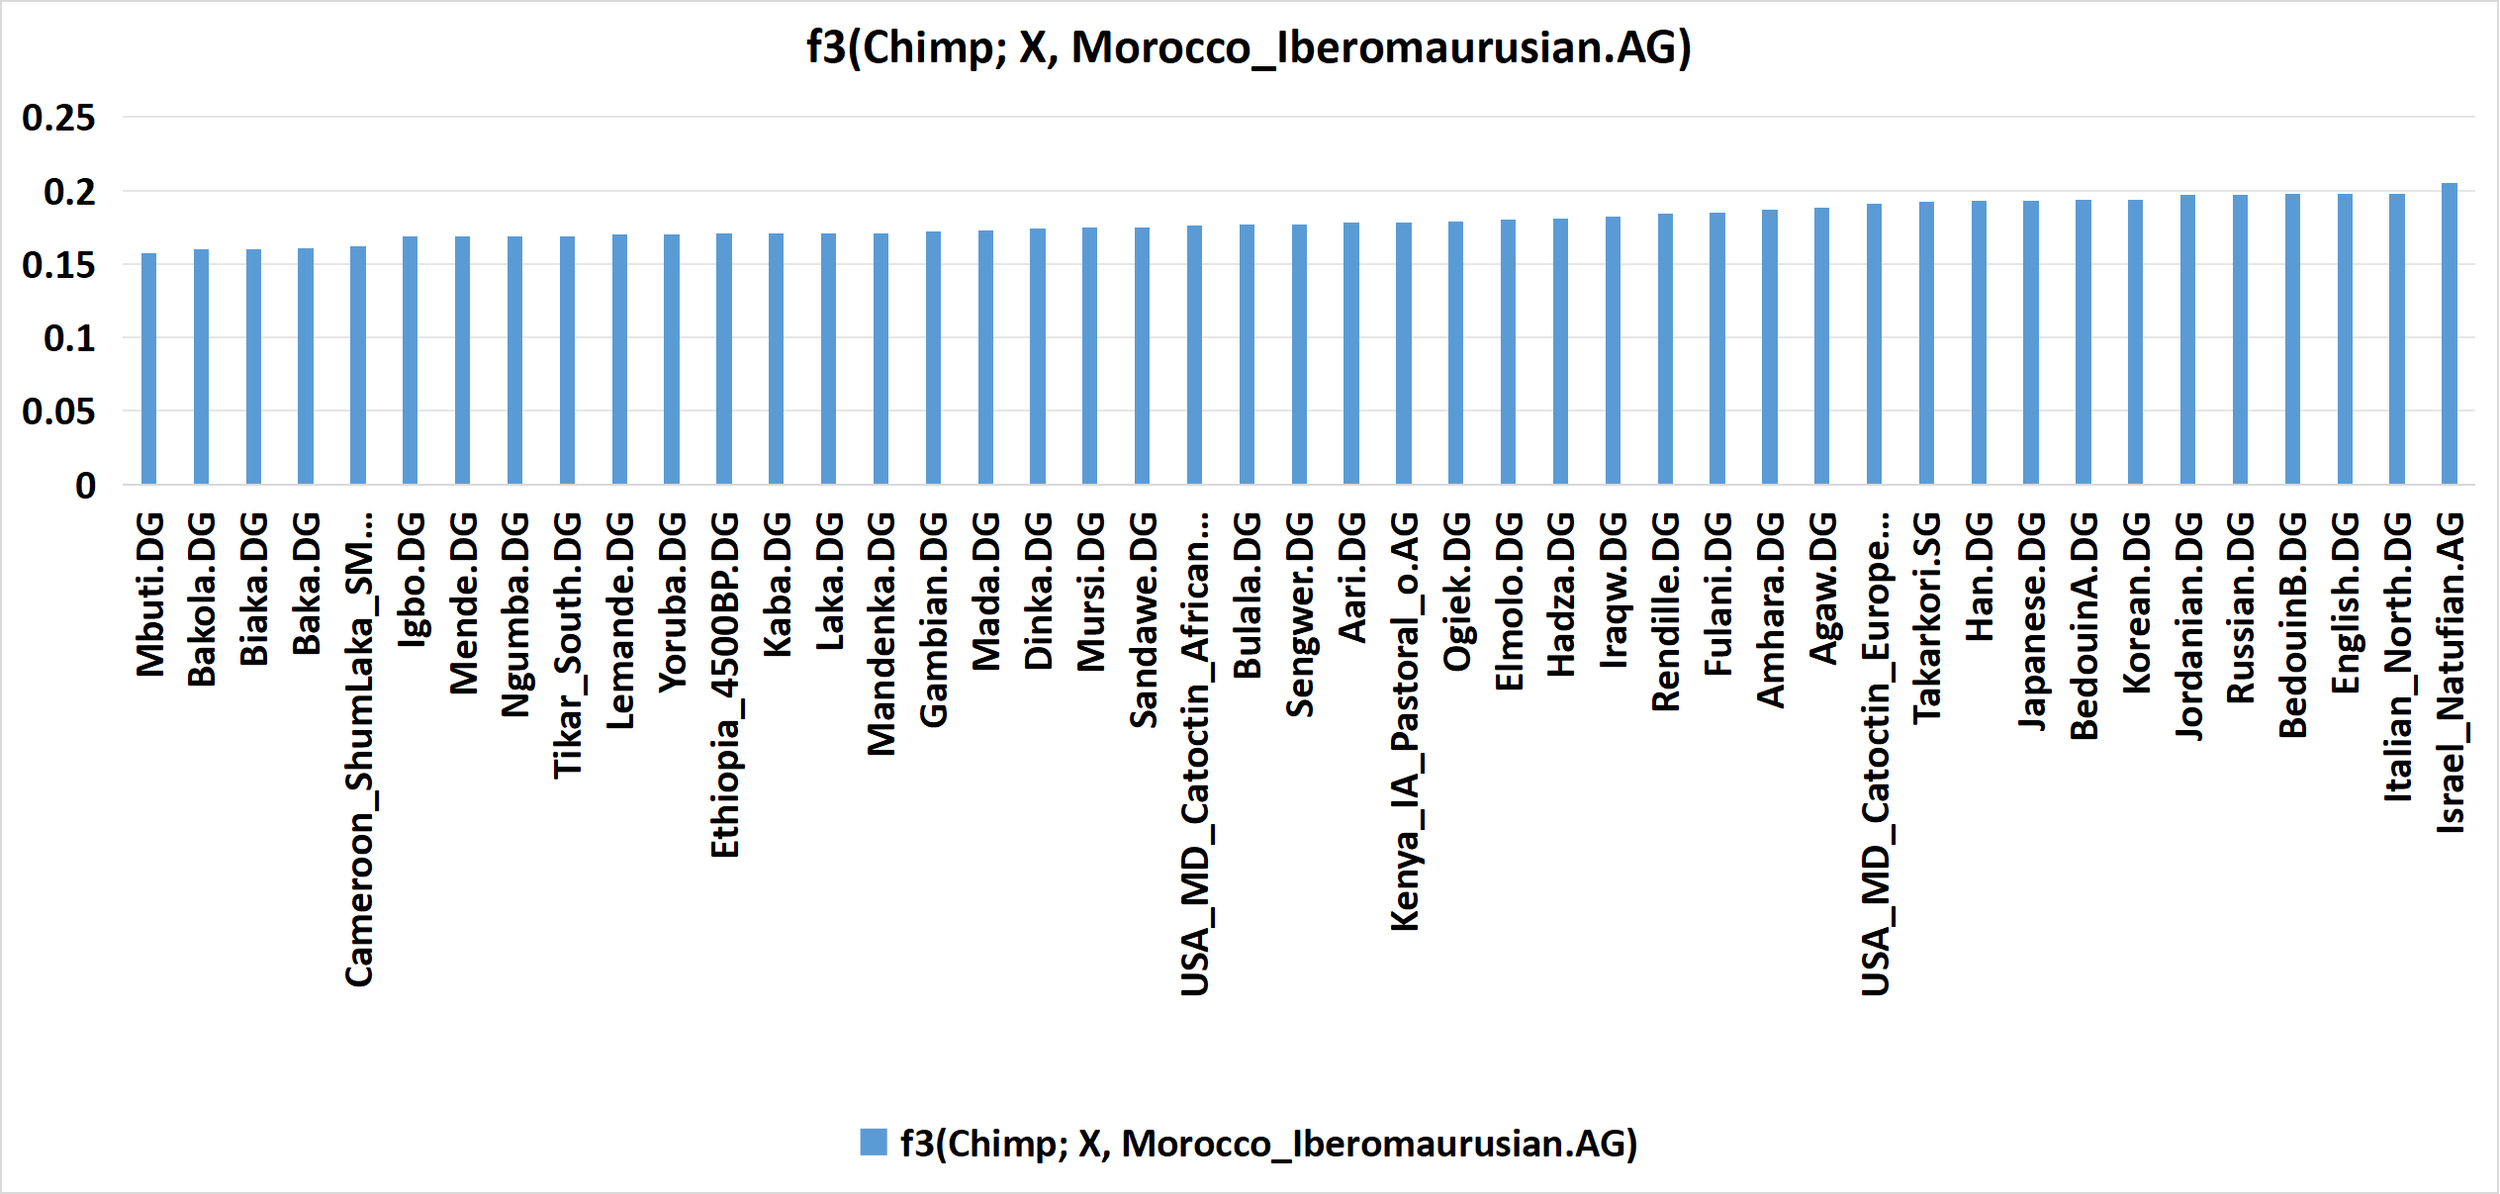
Bar graph of f3(Chimp; X, Morocco_Iberomaurusian.AG). Note that the f3 value for X = Takarkori.SG is not significantly greater than the values for X = Sub-Saharan African population; this indicates that the Takarkori pastoralists do not share significantly more drift with Iberomaurusians than Sub-Saharan Africans do. This is consistent with a minor degree of genetic drift that’s uniquely Iberomaurusian causing the Takarkori to share the most genetic drift with Iberomaurusians, which indicates that the Takarkori pastoralists carry Iberomaurusian admixture. Click here to see the input & output data in AdmixTools 2 that was used to produce this bar graph.
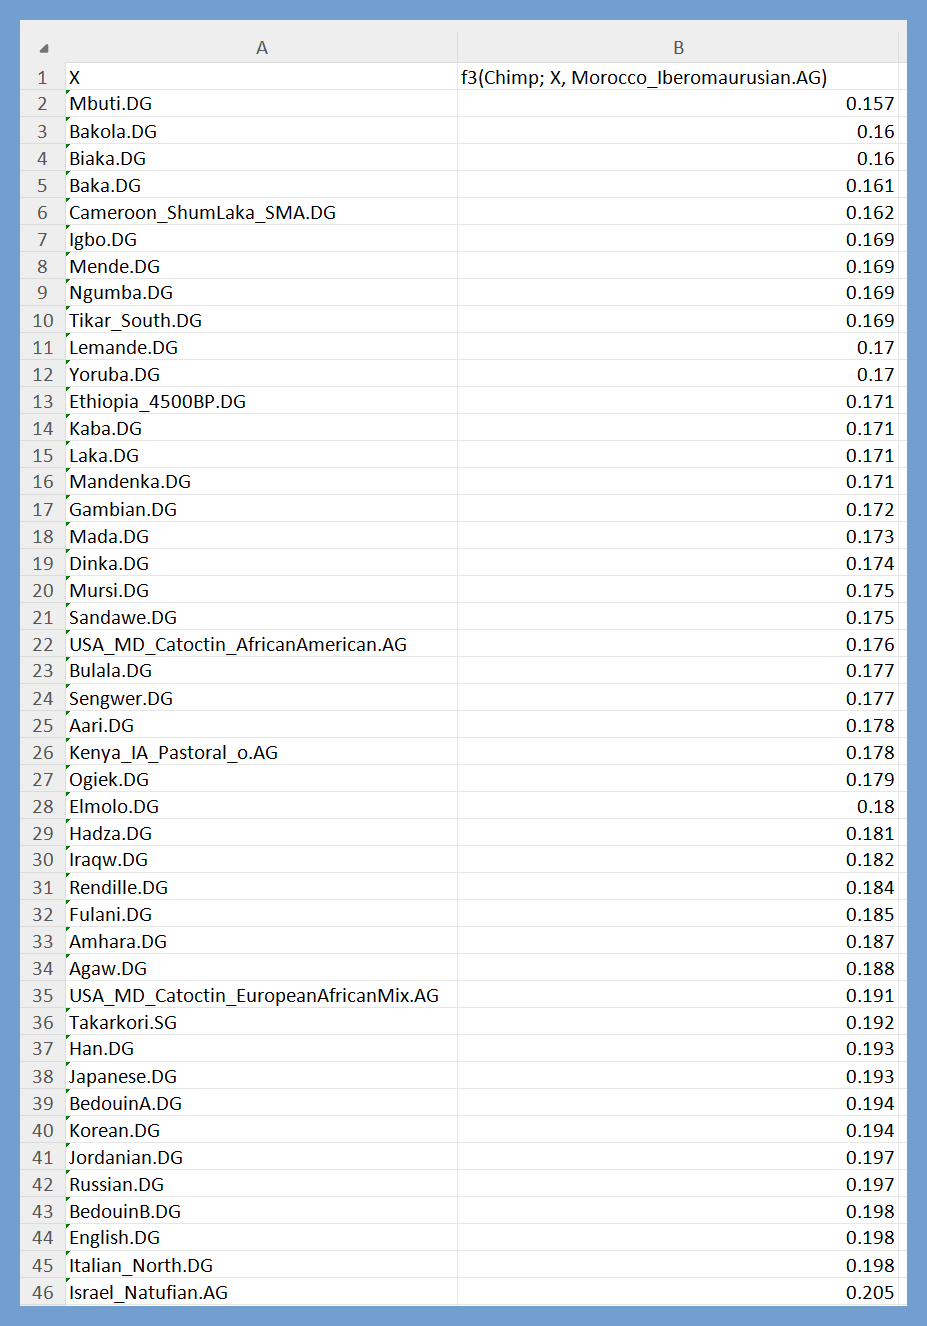
f3(Chimp; X, Morocco_Iberomaurusian.AG) in tabulated form. Notice that the values that correspond to X = Sub-Saharan African population are not significantly lower than those that correspond to X = Takarkori.SG. For example, f3 = 0.17 when X = Yoruba.DG, which is ~88.5% of the value for X =Takarkori.SG (0.192). This indicates that ~88.5% of the genetic drift that’s shared by Takarkori.SG and Morocco_Iberomaurusian.AG is also shared by Yoruba.DG.
As has been proven herein, f-statistics do not necessarily correspond to overall genetic relatedness or overall genetic similarity. Accordingly, even though the Takarkori pastoralists share the most genetic drift with Iberomaurusians, FST values indicate that the Takarkori pastoralists are genetically more similar to Sub-Saharan Africans than they are to Iberomaurusians.
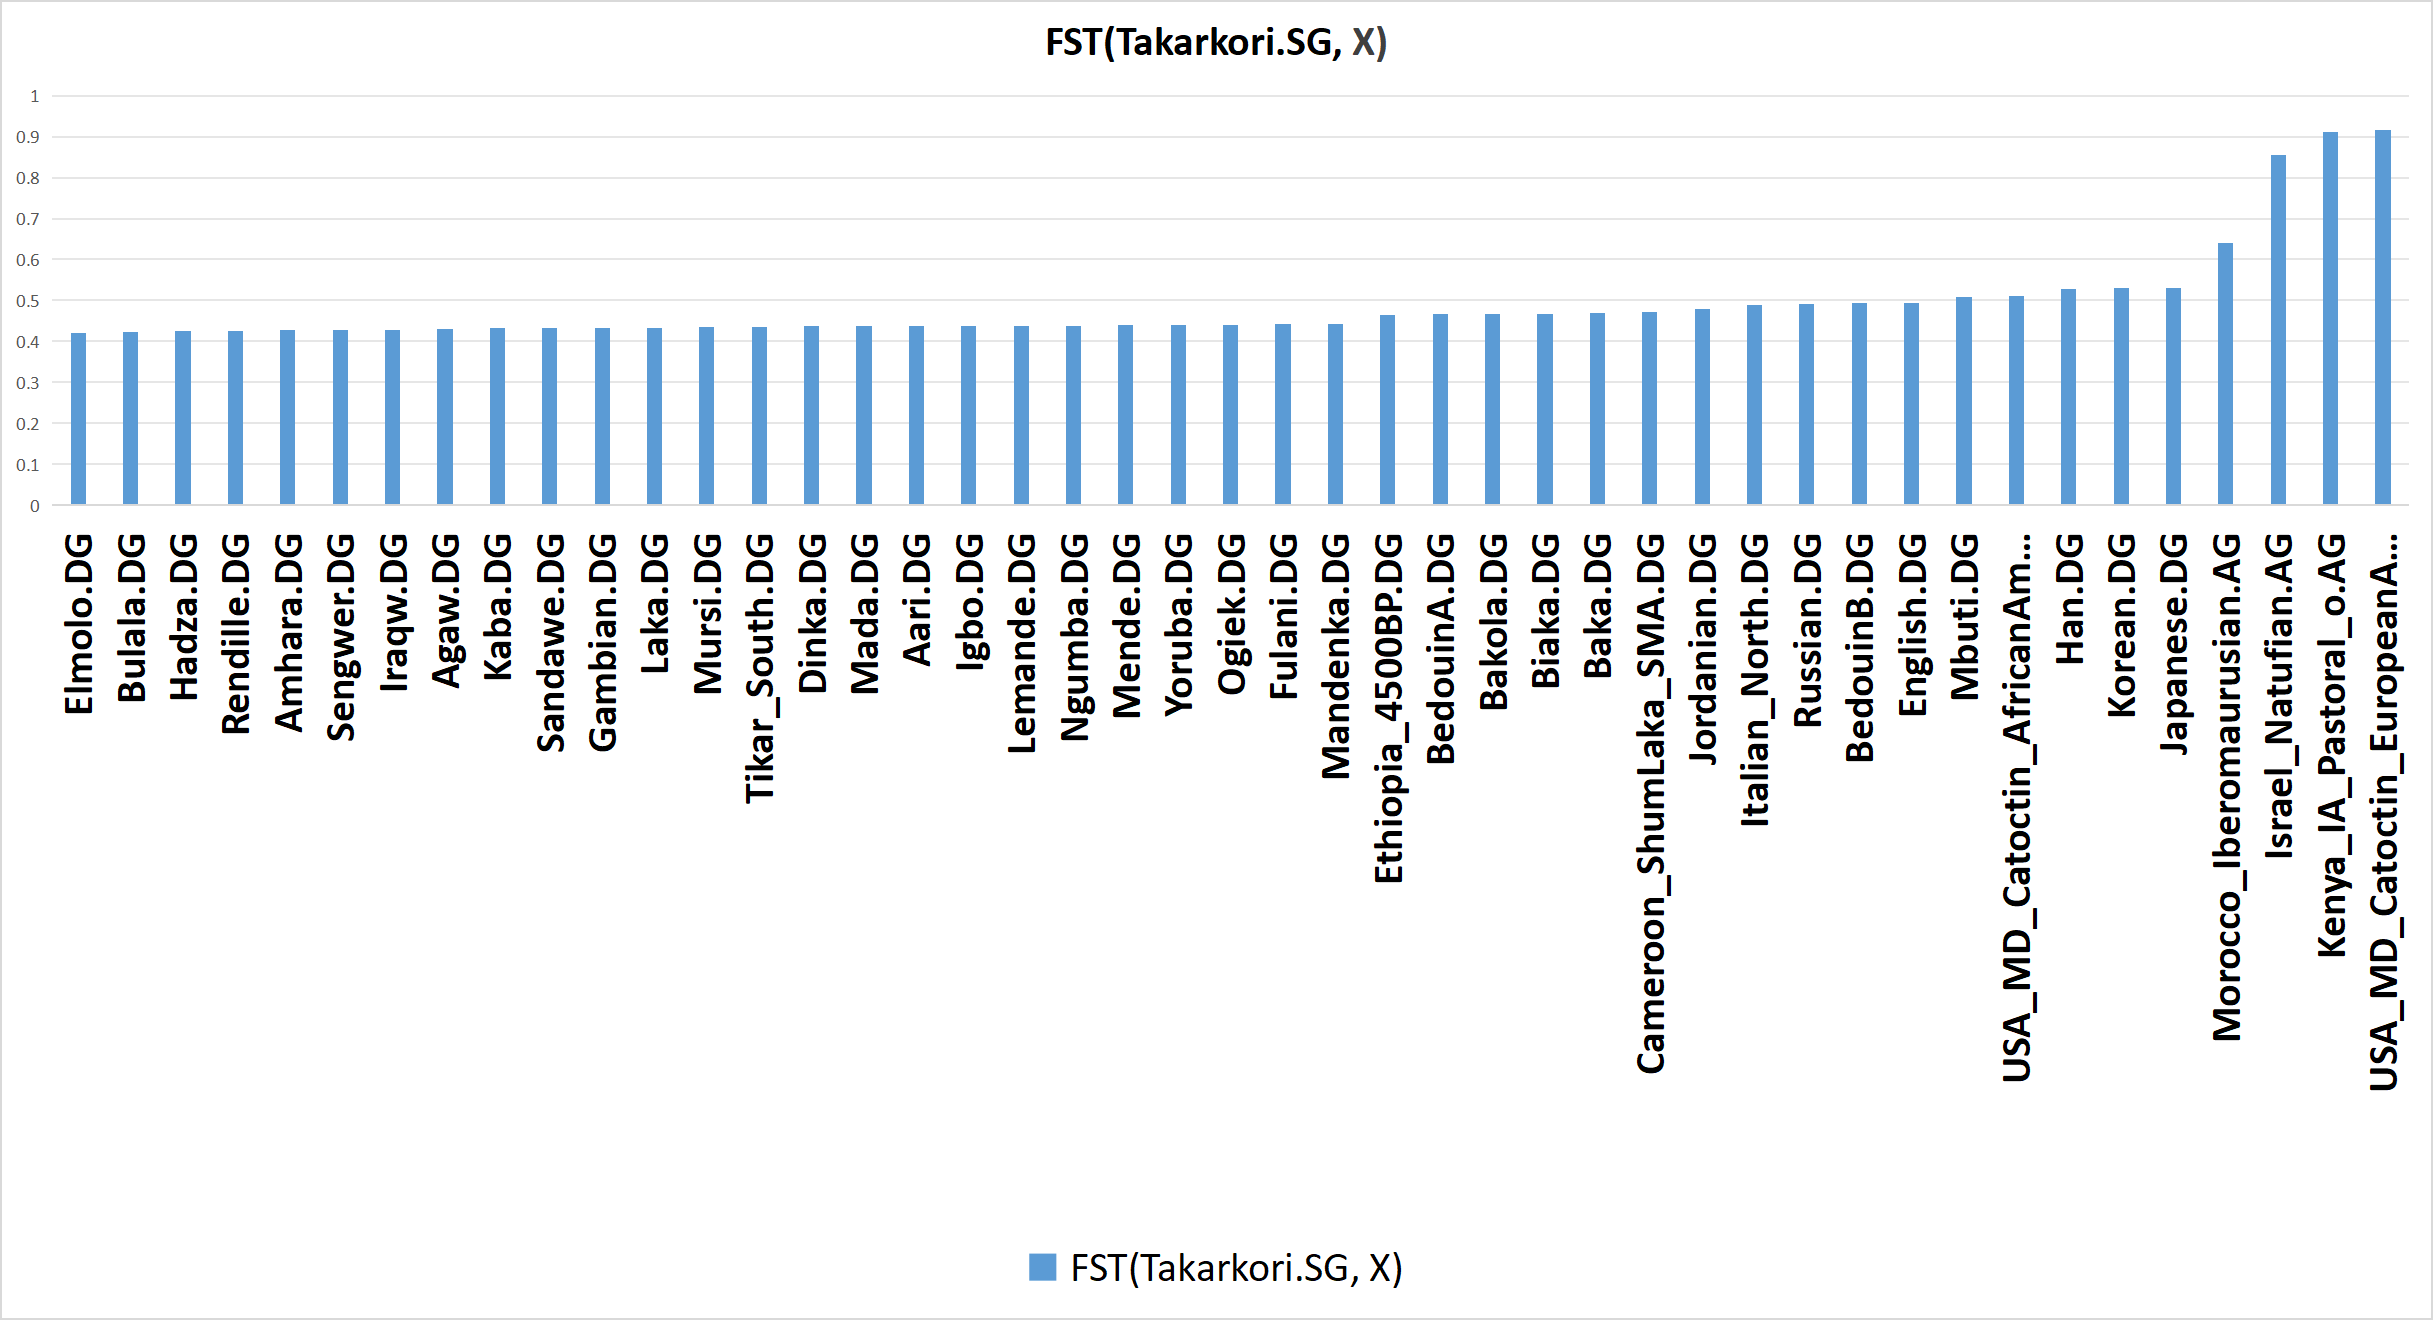
Bar graph of FST(Takarkori.SG, X), based on calculations computed by AdmixTools 2 using Version 62 of the AADR [Allen Ancient DNA Resource] (and appended populations). Click here to see the input & output data in AdmixTools 2 that was used to produce this bar graph.
Consistent with the Takarkori pastoralists’ greater genetic similarity to Sub-Saharan Africans than to Iberomaurusians, TKH001 is modelled as predominantly Sub-Saharan African (West African and East African) in one of the sets of ancestry models that are included at previous points herein; here is a separate set of ancestry models that shows this (note that TKH009’s genome coverage is very low, which is why it’s not included in models presented herein).
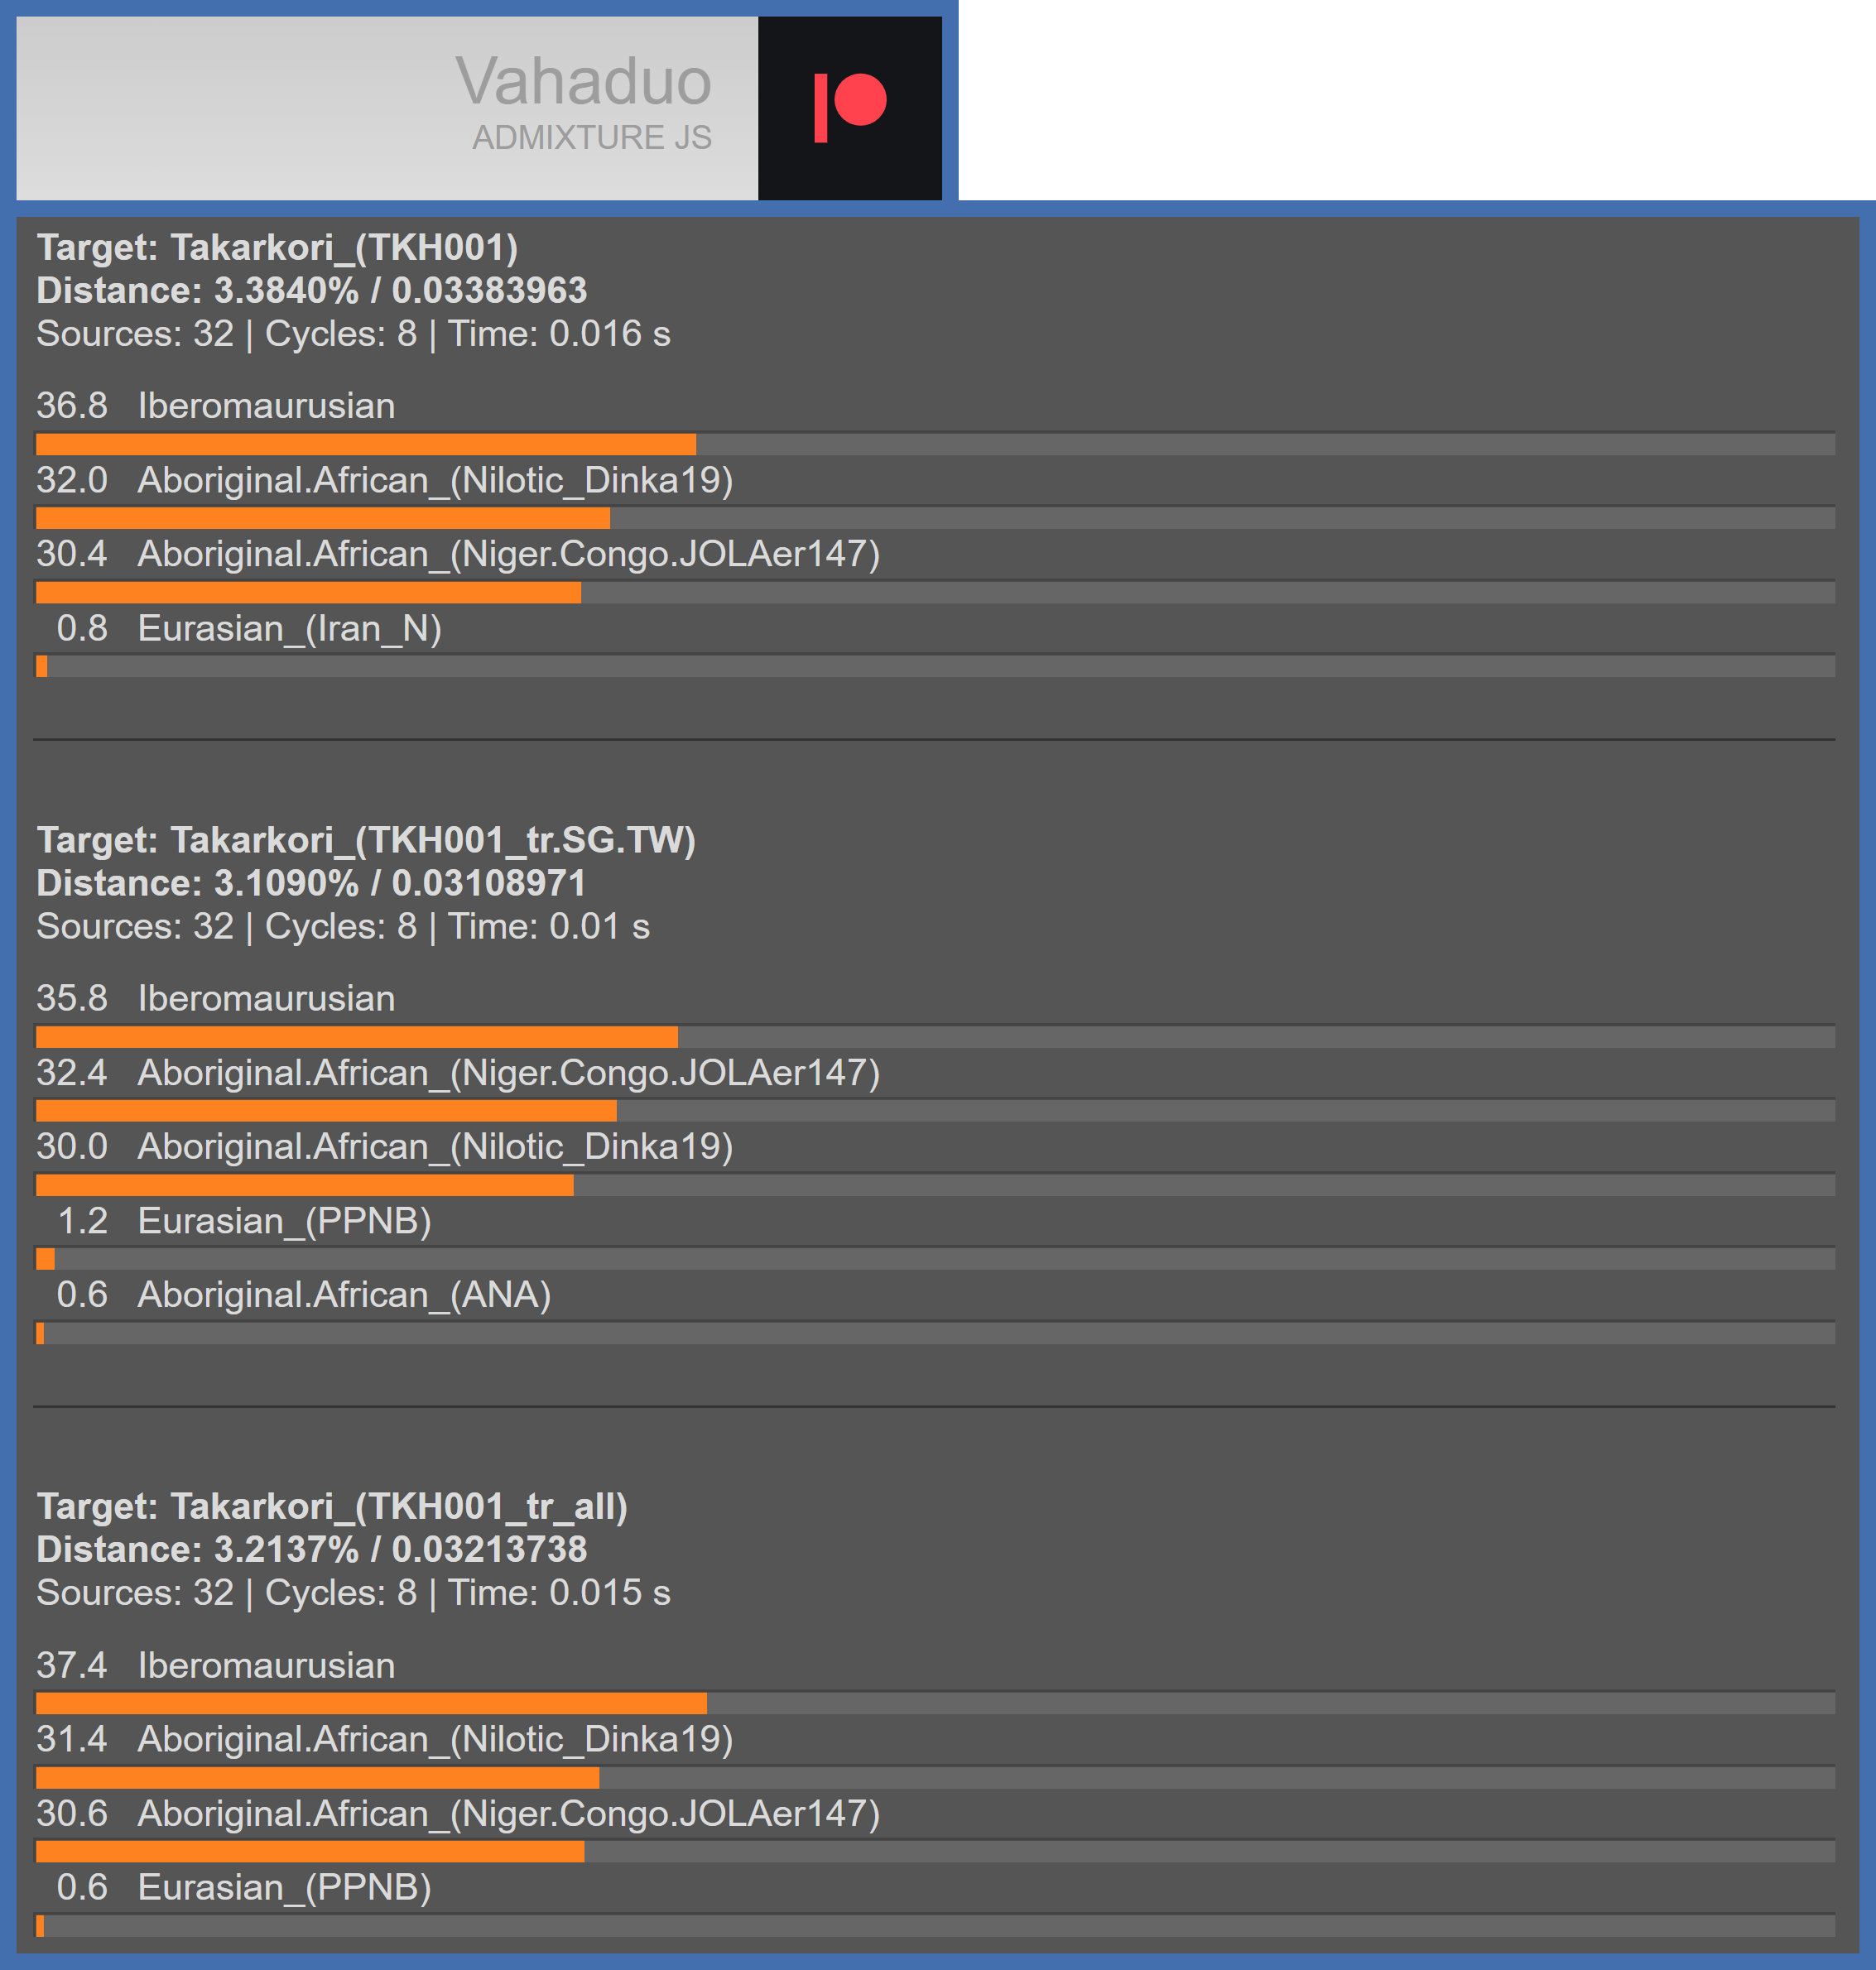
Ancestry models of TKH001. Note that she’s modelled as ~36% to ~37% Iberomaurusian, which partly explains why she shares the most genetic drift with Iberomaurusians. Unique genetic drift of Iberomaurusians combines with the rest of TKH001’s genetic drift (the overwhelming majority of which she also shares with Iberomaurusians - as well as Sub-Saharan Africans and all other modern human populations); this causes her to share the most genetic drift with Iberomaurusians rather than Sub-Saharan Africans - even though she’s predominantly Sub-Saharan African.
The formal statistics program qpAdm (QP Admixture) confirms the above models of TKH001, as can be seen in the below image.

A model of the Takarkori pastoralists produced by qpAdm; it uses a Mada individual to model 64.7% of their ancestry, and it uses the Iberomaurusians of Taforalt - Morocco to model 35.3% of their ancestry. The model’s p-value (probability value) is 0.245, which is notably higher than the minimum p-value (0.05) that’s considered to correspond to a plausible model.
The Mada are a Chadic people who reside in Cameroon. Ancestry models indicate that they predominantly carry a mixture of West and East African ancestries, plus very minor Iberomaurusian and Eurasian ancestries. The Mada and other peoples of the Sahel region seem to be the result of admixture events, which would have occurred between Niger-Congo peoples from West Africa and an ancient East African population.
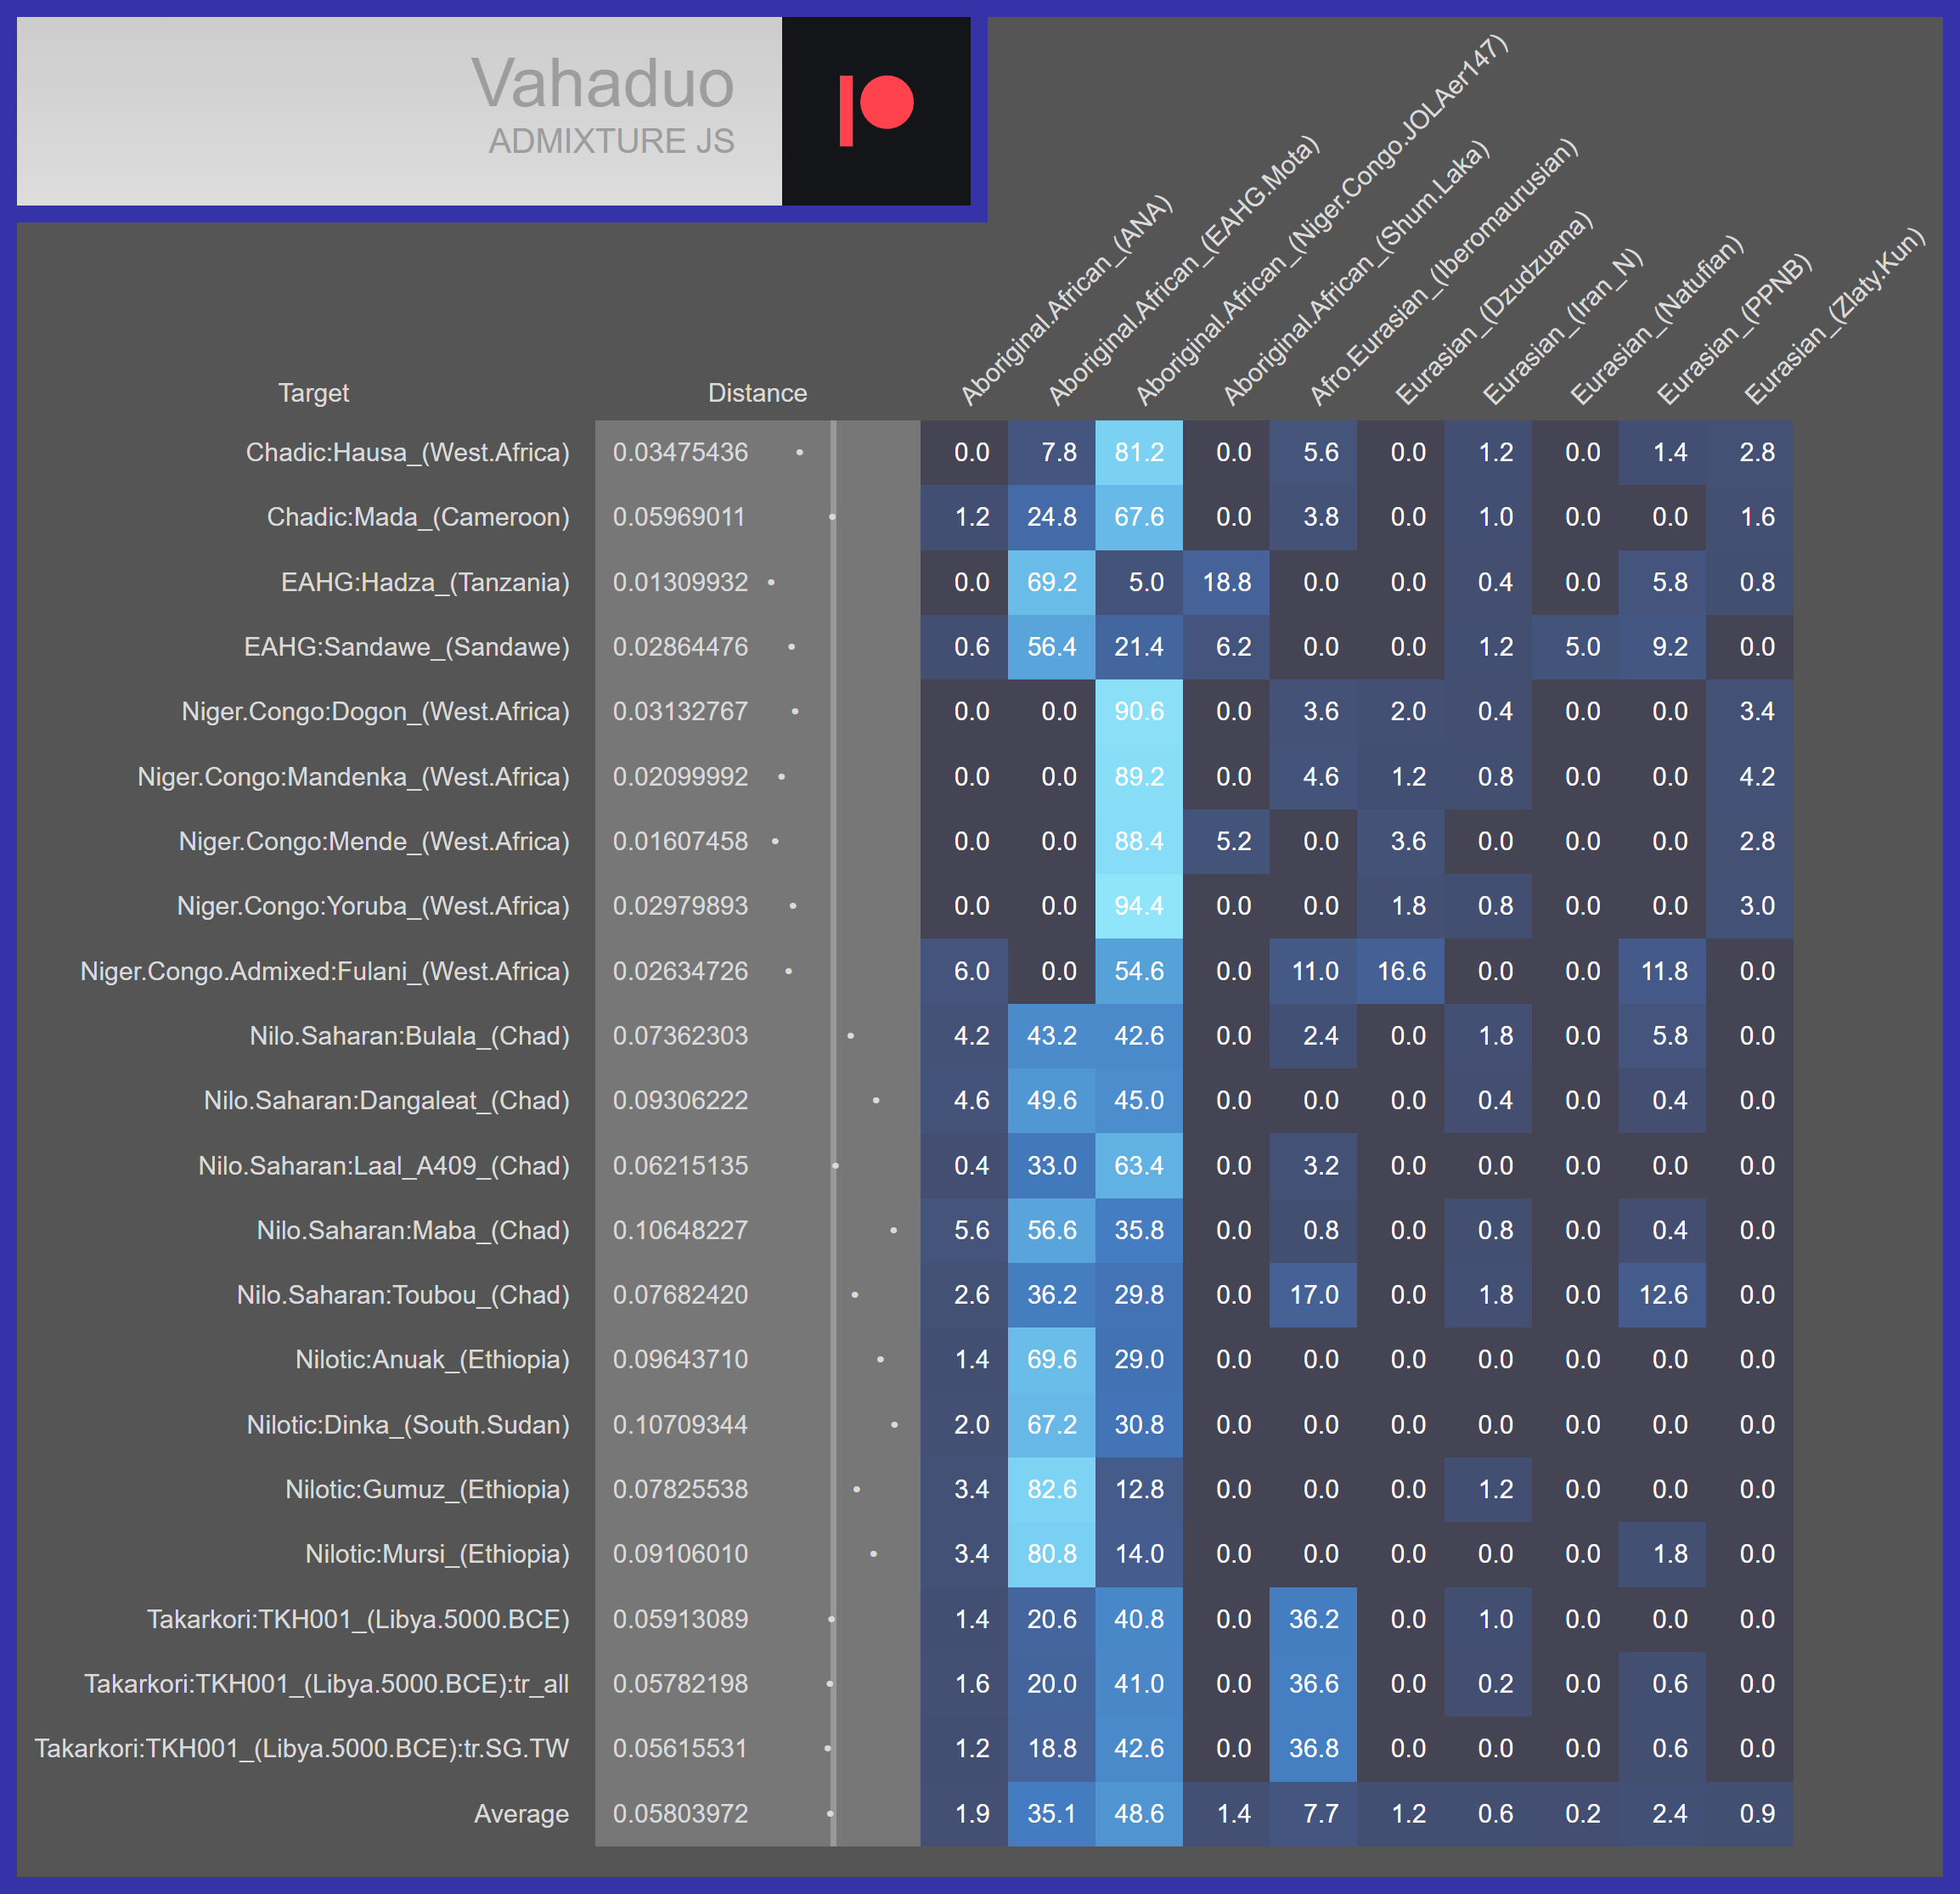
Ancestry models that include the Mada and other peoples of the Sahel (e.g. Nilotic peoples and other Nilo-Saharan peoples). Note that these models use Mota as the proxy for East African ancestry, since he lacks Niger-Congo ancestry (unlike Nilotes and other Nilo-Saharans); this makes him ideal for pulling out pure East African ancestry in the targets and not masking any of their Niger-Congo ancestry. Also note that the Gambian sample JOLAer147 is used as the proxy for Niger-Congo ancestry because it seems to be the purest Niger-Congo sample available, as can be seen here and here.
The region that spans from West Africa, across the Sahel, and into East Africa is known as Sudan (not to be confused with the countries Sudan and South Sudan, though they each partly comprise this region). Therefore, West Africans, Sahelians, and certain East Africans can be referred to as Sudanic or Sudanic Africans - and their ancestries can be referred to accordingly.
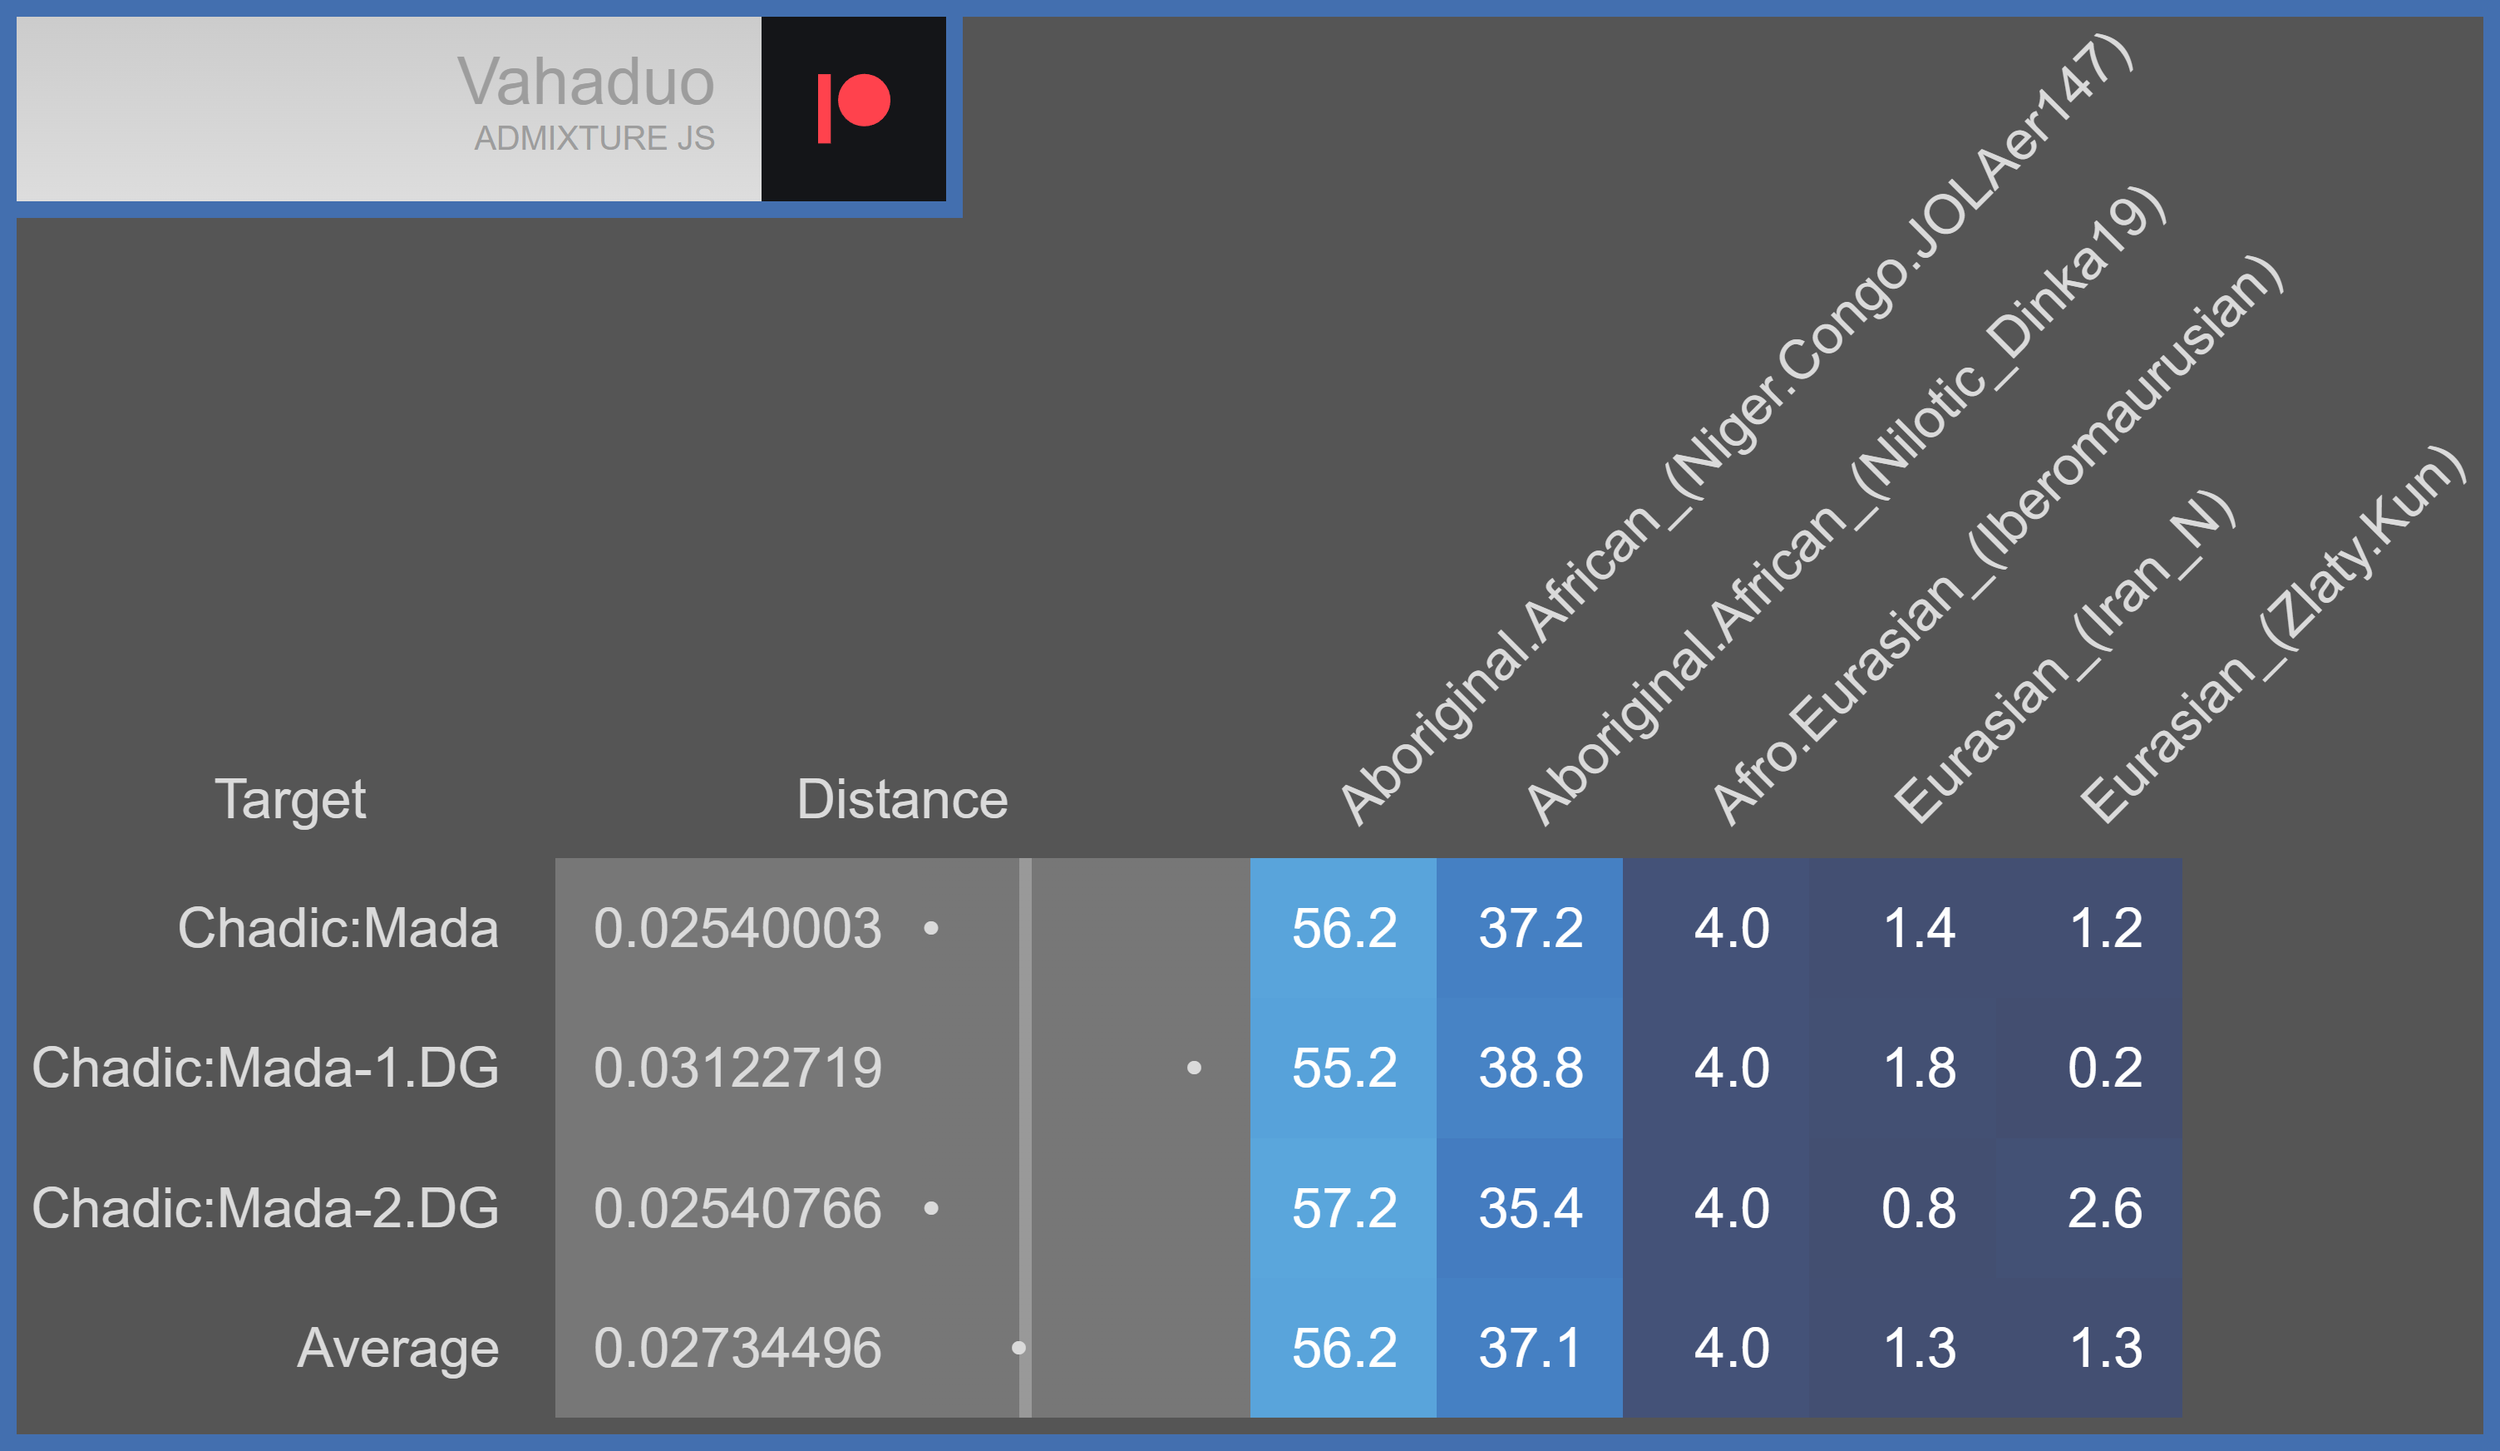
Vahaduo models the Mada as predominantly Sudanic African (56.2% Niger-Congo + 37.1% Nilotic = 93.3% Sudanic African); and it models them as minorly Iberomaurusian (4%) and Eurasian (2.6%). Note that the Eurasian components (i.e. Iran_N & Zlaty.Kun) likely represent undifferentiated Pre-OOA ancestry that’s shared by Aboriginal Africans and Eurasians, given how small they are.
Taking the Mada’s 4% Iberomaurusian component into account yields the following for the qpAdm model of the Takarkori: 64.7% Mada-1 + 35.3% Iberomaurusian → ~60% Sudanic African + ~40% Iberomaurusian.
Ironically, Salem et al (2025) themselves prove that the Takarkori are predominantly Sudanic African via the PCA charts of their article, as can be seen in the one below.

Extended Data Figure 2 of Salem et al (2025), which is a PCA (Principle Component Analysis) chart. Note that it positions the Takarkori pastoralists closest to the Bulala and the Kikuyu; the Bulala are a Nilo-Saharan people and the Kikuyu are a Bantu people (Bantus are a subset of Niger-Congo peoples). Conversely, it positions the Takarkori pastoralists far away from North Africans, Near Easterners, and Europeans.
Further proof that the Takarkori pastoralists are predominantly Sudanic African is the morphology of their skulls.
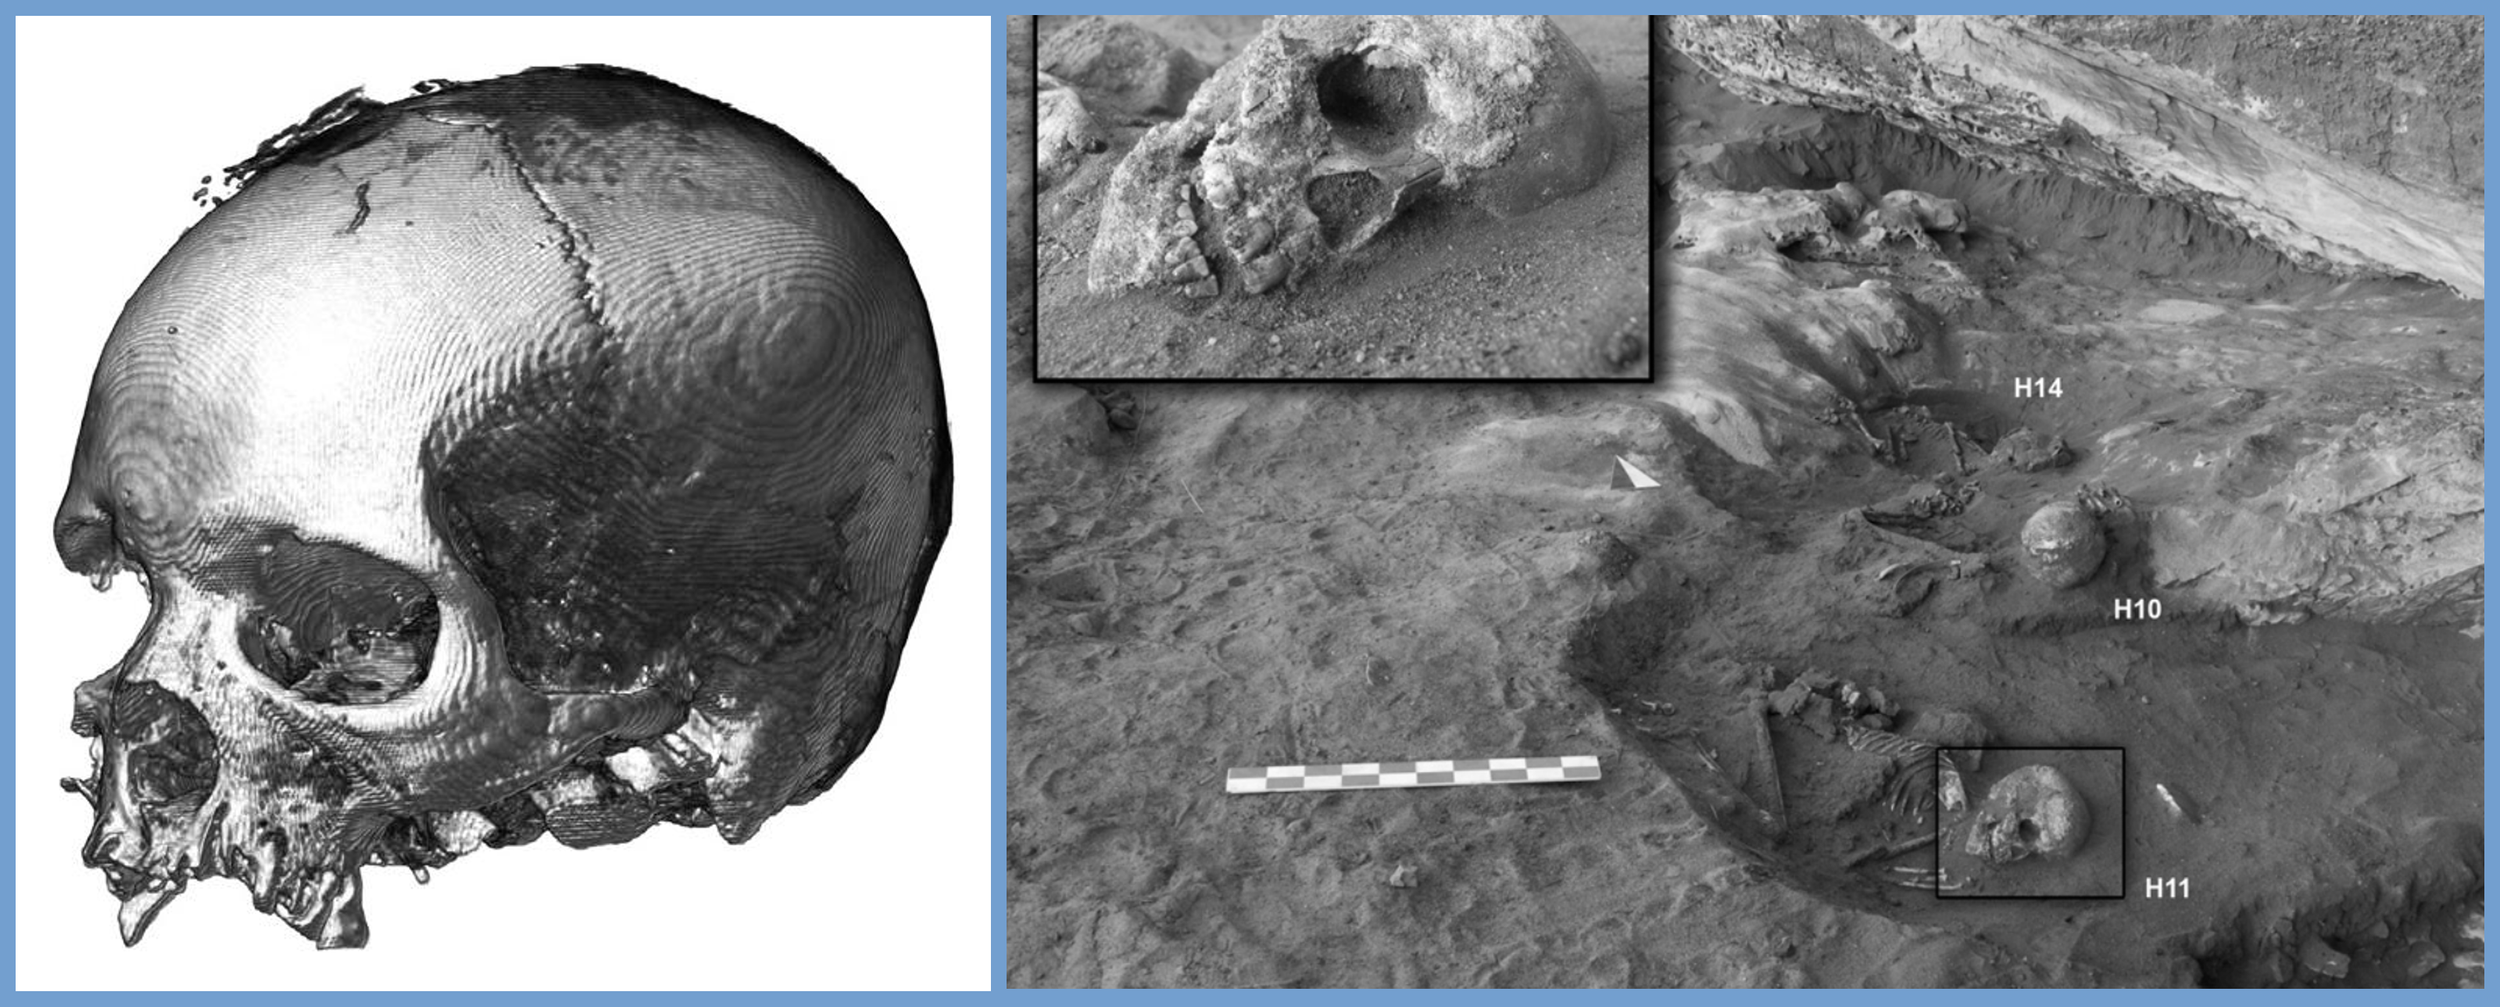
A composite image that includes TKH001’s skull (left) and other fossilized Takarkori pastoralists (right). As can be seen, they exhibit broad nasal apertures, flat nasal bridges, and large teeth - all of which are Sub-Saharan African traits.
All of the data that has been presented herein clearly prove that f-statistics do not necessarily correspond to overall genetic relatedness or overall genetic similarity. Furthermore, the data specifically prove that the Takarkori pastoralists’ ancestry is predominantly Sub-Saharan African (specifically Sudanic African), contrary to the assertion of Salem et al (2025).